A: CancerSCEM was a comprehensive database for revealing the tumor microenvironment of hundreds of widely collected cancer single-cell samples at the transcriptome level, and further provided a user-friendly website for browsing, searching, online analyzing and downloading all valuable analytical results, which was expected to support cancer single-cell researches and clinical diagnoses and immunotherapies.
A total of 28 projects covering 208 human cancer samples (20 cancer types) were catalogued into CancerSCEM. The raw single-cell RNA-seq data or gene expression matrix were collected from numerous databases and literatures, and data processing pipeline were built respectively for 10X Genomics platform and all other construction protocols (see 'Documents'). On the general analysis page for each sample, 1) the statistics of expressed genes, UMI counts and mitochondria RNA percentages, 2) unsupervised cell clustering in both tSNE and UMAP manner, 3) cell components and proportions, 4) differential expressed gene lists for each cell type and their GO/KEGG enrichments, 5) expression patterns of functional receptor genes, ligand genes, oncogenes and TSGs in dotplot were presented. On the online analyze page, user can specify a unique sample ID, gene symbol or gene ID to query the expression of target gene in multiple dimensions in the target sample, or perform downstream analysis like cell-cell interactions and survival analysis, etc (see 'Documents').
A: There were several ways you can search or filter the datasets of interest. First, a quick search box and a keyword cloud on the home page were equipped, you can input any cancer type/gene symbol/gene ID or select any key word from the word cloud, an instant query to the database would be triggered. Alternatively, four advanced search modules on the search page were more recommended. user can specify project, sample, gene, cancer type or data construction protocol to seek out their target datasets. Moreover, the searching bar on the left side and the filter item by sample size at the top of the project browse table also worked.
A: It was still challenging for researchers to accurately identify the cell types especially for different malignant cells and various subtypes of immune cells. CancerSCEM performed a combined 'three-step' strategy for cell type recognition: 1) The softwares scCancer and CopyKAT were firstly utilized for the copy number variation assessment respectively for 10X Genomics datasets and all other datasets, and several marker genes representing cancer cells or cancer stem cells (EPCAM, KRT8, KRT18, KRT19 and EGFR especially for glioblastoma cells, etc.) were parallelly used. cells with significantly abnormal CNV levels and high expression levels of above marker genes could be defined as malignant cells. 2) Manual annotations were next performed based on the expression of dozens of canonical markers for common cell types like T cells, B cells, Macrophages/Monocytes, Mast cells, Endothelial cells, Fibroblasts, Oligodendrocytes and Astrocytes etc. 3)Through the comprehensive evaluations of currently available tools for cell-type identifications including SingleR, SciBet, ScPred, Garnett and Scmap, SingleR was considered as the optimal tool for immune subtype recognition, only T cells and B cells were further classified into subtypes.
A: Two analyze modules were equipped on the online analyze page. Gene analyze module mainly focused on the 1) Gene Expression (GE) in Sample - whole expression profiles of target gene in specified cancer single-cell sample and 2) GE in Subtypes - it's expressions in different cell subtypes in the sample, 3) GE Correlation - gene expression correlation analysis in the specific sample and 4) GE Comparison - expression comparison between different single-cell RNA-seq or TCGA bulk RNA-Seq datasets. Sample analyze module included three functions: 1) Cell Component Comparison - cell type component comparison between single-cell samples, 2) Cell Interaction - interaction network construction between different cell types and 3) Survival Analysis - survival analysis based on TCGA bulk RNA-Seq data and clinical survival data.
In any analyze module, user need to specify the key information like sample ID and gene symbol, and a list of important immune checkpoint receptor and ligand genes would be provided that user can directly select. Thus, user can generate the expression patterns in the whole sample, in different cell subtypes, between different cancer types through the gene analyze module, and cell component comparison, cell-cell interaction networks and survival analysis of the specified samples or cancer types could be obtained by the sample analyze module. All analytical results could be shown in real time once user triggered the 'Go' button.
A: Definitely. As one of important database resources in National Genomic Data Center, more single cell RNA-Seq data which covering more types of human cancers will be continually collected in our update versions, and ongoing improvement is developing more useful modules in CancerSCEM at the meantime. Accordingly, the update news will be synchronously released on the home page.
If you have any question or any suggestion/comment, please feel free to contact us via email (cancerscem(AT)big.ac.cn).
National Genomics Data Center, China National Center for Bioinformation
Beijing Institute of Genomics, Chinese Academy of Sciences
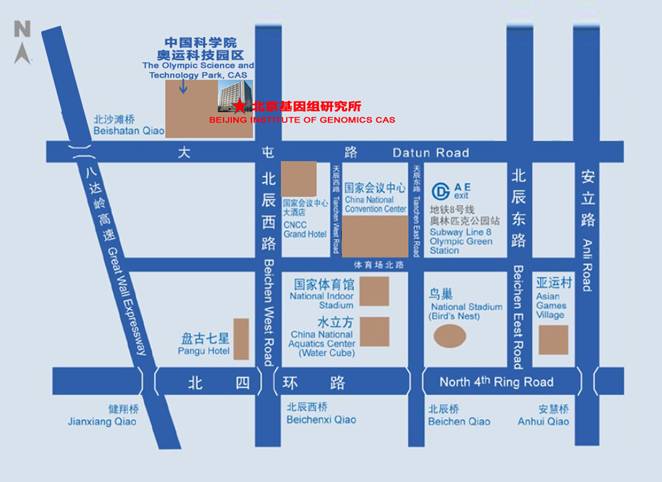
No. 104 building, No.1 Beichen West Road, Chaoyang District
Beijing 100101, China
Tel: +86 (10) 8409-7443
Fax: +86 (10) 8409-7720
