Introduction
1 What is LncExpDB?
LncExpDB 2.0 features enriched biological contexts, expanded expression data, scenario-specific functional analyses, and new analytical tools.
LncExpDB is a comprehensive expression database that systematically profiles human long non-coding RNAs (lncRNAs) across multiple biological contexts. In the current version, six new biological contexts—immunotherapy, aging, metabolic disease, neurodegenerative disease, reproduction, and wound healing—have been incorporated, expanding the total to 15 contexts. These contexts collectively cover diverse physiological and pathological processes and are derived from extensive high-quality datasets encompassing 29 datasets and 2,662 samples.
Based on these 15 contexts, LncExpDB provides a global landscape of lncRNA expression, including overall expression profiles, highly expressed lncRNAs, featured lncRNAs with function-linked patterns, and extensive lncRNA–mRNA interaction pairs. To enhance analytical capacity and user experience, two new analytical tools have been integrated, together with an automated pipeline module that supports reproducible data processing and expression analysis. The usage and implementation details of these new tools are documented in the Help section for easy reference.
Collectively, LncExpDB serves as a versatile and user-friendly platform for exploring lncRNA expression, regulation, and functional associations across diverse biological scenarios.
Moreover, LncExpDB is equipped with user-friendly web interfaces, providing functionalities for data query, browsing, visualization as well as easy access.
Data and Methods
2.1 Data collection
LncExpDB collects a total of 29 RNA-seq datasets comprising 2,662 samples were collected from public databases such as GEO, SRA and ArrayExpress, covering 374 biological conditions across 15 biological contexts. These contexts include normal tissues and cell lines, organ development, preimplantation embryos, cell differentiation, subcellular localization, exosomes, cancer cell lines, virus infection, circadian rhythm, and newly added contexts such as tumor immune microenvironment, aging, and other biological processes. In addition, version 2.0 provides enriched expression features, including 44,752 highly expressed genes, 39,253 featured genes, and 35,188,816 lncRNA–mRNA co-expression pairs. To further facilitate biological interpretation, new analytical modules such as LncNet and LncImm have been integrated, supporting context-specific characterization such as tumor immune microenvironment signatures and age-related expression trends. Moreover, the pipeline code has been made publicly available to ensure reproducibility and extensibility.
| Biological Context | Project ID | Dataset | Source | Sample Number | PMID |
|---|---|---|---|---|---|
| Normal Tissue/Cell | E-MTAB-2836 | The Human Protein Atlas | EBI ArrayExpress | 121 | 28940711 |
| SRP013565 | ENCODE Primary Cell Lines | NCBI SRA | 111 | 29126249 | |
| Organ Development | E-MTAB-6814 | Development of Brain | EBI ArrayExpress | 55 | 31243368 |
| E-MTAB-6814 | Development of Cerebellum | EBI ArrayExpress | 59 | 31243368 | |
| E-MTAB-6814 | Development of Heart | EBI ArrayExpress | 50 | 31243368 | |
| E-MTAB-6814 | Development of Kidney | EBI ArrayExpress | 40 | 31243368 | |
| E-MTAB-6814 | Development of Liver | EBI ArrayExpress | 50 | 31243368 | |
| E-MTAB-6814 | Development of Ovary | EBI ArrayExpress | 18 | 31243368 | |
| E-MTAB-6814 | Development of Testis | EBI ArrayExpress | 41 | 31243368 | |
| Preimplantation Embryo | PRJNA291062 | Oocyte to Lateblastocyst (7 Stages) | NCBI SRA | 35 | 27315811 |
| PRJNA153427 | Oocyte to Lateblastocyst (9 Stages) | NCBI SRA | 90 | 23934149 | |
| Cell Differentiation | PRJNA504841 | Cell Differentiation | NCBI SRA | 297 | 31249060 |
| Subcellular Localization | PRJNA476786 | Subcellular Localization | NCBI SRA | 36 | 31230715 |
| Exosome | PRJNA414172 | Blood Exosomes from Early-Stage Esophageal Squamous Cell Carcinoma Patients vs. Normal Control | NCBI SRA | 12 | 32043367 |
| PRJNA390615, PRJNA390988 | Blood Exosomes from Colorectal Cancer Patients vs. Normal Control | NCBI SRA | 44 | 30053265 | |
| PRJNA390615, PRJNA390988 | Blood Exosomes from Coronary Heart Disease vs. Normal Control | NCBI SRA | 38 | 30053265 | |
| PRJNA390615, PRJNA390988 | Blood Exosomes from Hepatocellular Carcinoma vs. Normal Control | NCBI SRA | 53 | 30053265 | |
| PRJNA390615, PRJNA390988 | Blood Exosomes from Pancreatic Adenocarcinoma Patients vs. Normal Control | NCBI SRA | 46 | 30053265 | |
| Cancer Cell Line | PRJNA523380 | Cancer Cell Line | NCBI SRA | 658 | 31068700 |
| Virus Infection | PRJNA517165 | HIV Infection vs. Normal Control | NCBI SRA | 22 | 30185599 |
| PRJNA517165 | HBV Infection vs. Normal Control | NCBI SRA | 48 | 30185599 | |
| PRJNA517165 | HCV Infection vs. Normal Control | NCBI SRA | 24 | 30185599 | |
| PRJNA615032 | COVID Patients vs. Normal Control | NCBI SRA | 4 | 32416070 | |
| Circadian Rhythm | PRJNA454445 | Circadian Rhythm | NCBI SRA | 153 | 30201705 |
| Immunotherapy | PRJNA624338 | Lymphoma | NCBI SRA | 20 | 33024998 |
| PRJNA356761 | Melanoma | NCBI SRA | 58 | 29033130 | |
| PRJNA557841 | Non-Small Cell Lung Cancer | NCBI SRA | 27 | 31537801 | |
| PRJEB25780 | Stomach Cancer | EMBL ENA | 36 | - | |
| Aging | PRJNA413568 | Brain | NCBI SRA | 18 | 29507413 |
| PRJNA690800 | Skeletal Muscle | NCBI SRA | 53 | 33795677 | |
| PRJNA223350 | Skin | NCBI SRA | 20 | 25977295 | |
| Metabolic Diseases | PRJNA642130 | Type II Diabetes | NCBI SRA | 30 | 30185599 |
| PRJNA1021256 | Metabolically Healthy / Unhealthy Obesity | NCBI SRA | 53 | 38569471 | |
| PRJNA1071142 | Hypertension | NCBI SRA | 148 | 39167456 | |
| Neurodegenerative Disease | PRJNA413568 | Alzheimer's disease | NCBI SRA | 22 | 29507413 |
| PRJNA779421 | Huntington's disease | NCBI SRA | 28 | 39028640 | |
| PRJNA1166189 | Parkinson's disease | NCBI SRA | 6 | 40164620 | |
| Reproduction | PRJNA421274 | Oocytes | NCBI SRA | 147 | 30472193 |
| Wound Healing | PRJNA730912 | Skin | NCBI SRA | 20 | 39366968 |
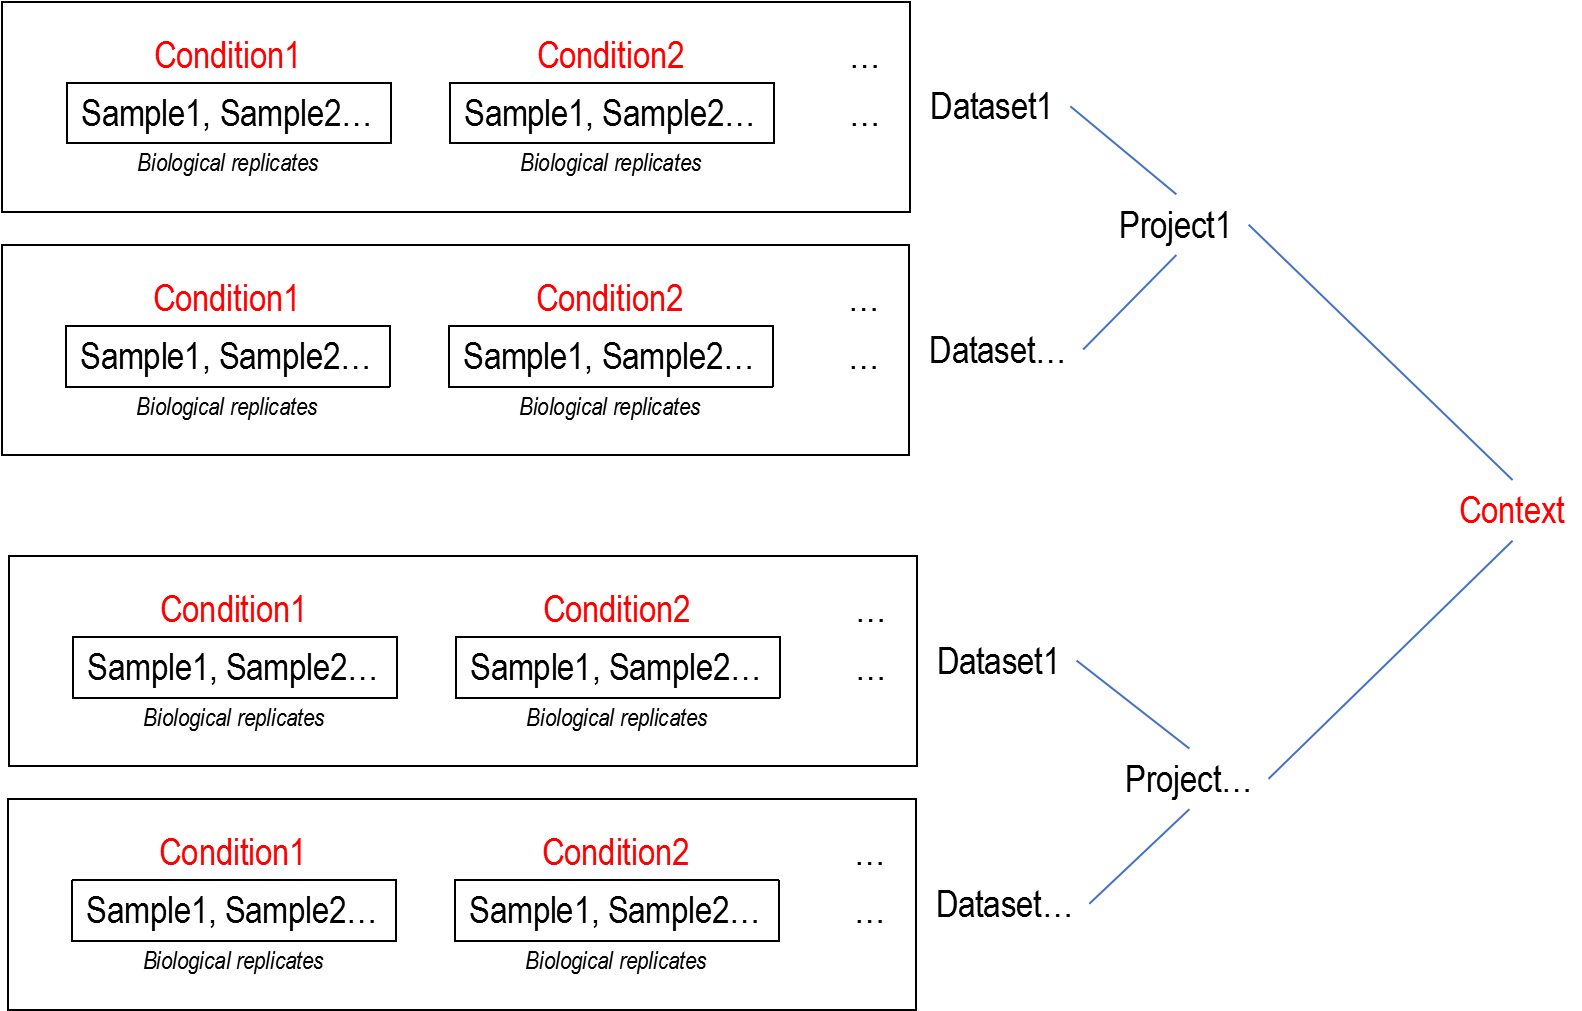
2.2 Data structure
2.3 Read mapping, quantification and normalization
All samples are processed by a standardized RNA-seq pipeline (Trimmomatic, FastQC, STAR, RSeQC, Kallisto and featureCounts/ RSEM) to get the abundance matrixes (reads count, CPM, FPKM and TPM) of lncRNAs. The raw abundance matrixes are normalized by TMM method.
2.4 Estimation of transcription reliability
LncExpDB considers lncRNA genes with maximum expression values less than 1.0 TPM in a certain biological condition as not expressed (NE). If the lncRNA genes are tagged with NE in all biological conditions available, they are most likely unreliable lncRNA genes. Of course, it is possible that this definition may change when novel biological conditions are covered.
2.5 Estimation of lncRNA expression capacity
All expressed genes(lncRNAs and mRNAs) are ranked in a specific condition (time point/stage/tissue/cell/component/processing). Specifically, genes with expression values greater than the upper quantile are classified as “H” (high expression level), those less than the lower quantile as “L” (low expression level), and the remaining as “M” (medium expression level). High-capacity lncRNAs (HCL) are genes with “H” classification in at least one condition, and low-capacity lncRNAs (LCL) are those with “L” in all conditions, and the remaining are medium-capacity lncRNAs (MCL). It is noted that with more biological conditions covered, LCL or MCL may change to MCL or HCL.
2.6 Identification of high-confidence featured lncRNAs
LncExpDB identifies and characterizes featured lncRNA genes that are specifically expressed in a certain cell line/tissue, differentially expressed in the context of cancer or virus infection, enriched in a subcellular compartment, dynamically expressed during cell differentiation or embryo/organ development, or periodically expressed with circadian rhythm.
The featured genes are identified using specialized methods with strict criteria:
2.7 LncRNA-mRNA interaction prediction
LncExpDB predicts lncRNA-mRNA interactions based on co-expression networks. Co-expressions relationships between lncRNAs and mRNAs are identified using the Pearson correlation coefficient (adjusted p-value < 0.01 and |r|>=0.5). It is noted due to the extremely small sampling size (n = 4), the dataset of “COVID patients vs. normal control” is not analyzed in this section.
Database Usage
3.1 Quick start in LncExpDB
Enter a gene symbol or gene ID (LncExpDB ID) in the search box on the homepage to explore the lncRNA of interest. In the “Resources” part or “Context” section in the navigation bar, the click of each context will lead you to explore the expression profiles of featured lncRNAs and lncRNA-mRNA interactions across different biological conditions in the corresponding biological contexts, where you can view the defined featured genes or explore a group of lncRNA genes of interest with customized filtration.
To overview expression capacities/featured genes/interactions across different contexts, please click on “Expression Capacity”, “Featured Genes” and “Interactions” in the navigation bar.
3.2 Browse lncRNA genes in LncExpDB
You can browse all lncRNAs in the "Genes" page with the basic information of gene id/symbol, classification, chromosome, strand, location, gene length and transcript number. You can search lncRNAs of interest by gene id/transcript id derived from LncBook v1.2, RefLnc, NONCODE v5, GENCODE v33, CHESS v2.2, FANTOM-CAT (lv4_strigent) and BIGTranscriptome or gene symbol derived from HGNC, chromosome or classification type, and the gene id is linked to detailed information page of expression profiles in different contexts. In the detaied gene page, all corresponding gene and transcript id provide hyperlinks to their orginal pages. In addition, users can view our reference gene track on UCSC Genome Browser.
3.3 Explore featured genes in LncExpDB
You can explore featured lncRNAs in the "Featured Genes" page, which covers tens of thousands of featured genes with specific expression patterns in at least one biological context. You can filter and/or re-order the table content using the categories and search boxes in the header line. Each gene id is linked to detailed information page of expression profiles in different contexts.
3.4 View featured lncRNAs and interactions among biological contexts in LncExpDB
You can view all types of biological samples in the "Contexts" page including normal tissues and cell lines, organ development, preimplantation embryos, cell differentiation, subcellular localization, exosome, cancer cell line, virus infection and circadian rhythm. Each context page contains the tabs of “Featured Genes” and “Interaction”.
By clicking the tab of “Featured Genes”, you can select specific datasets of interest and browse all defined featured genes, e.g., specifically or consistently expressed genes in a certain context. In addition, you can select a specific group of genes with custom thresholds. You can filter and/or re-order the expression profile table using the categories and search boxes in the header line.
By clicking the tab of “Interactions”, you can select specific datasets of interest and browse the cis or trans interactions between lncRNAs and mRNAs. Moreover, you can select a specific group of interaction by custom thresholds or search the related interactions by lncRNA/protein-coding id or symbol.
3.5 Browse expression capacity in LncExpDB
In the "Expression Capacity" page, you can browse the lncRNA’s expression capacity in various biological contexts. You can filter for high-capacity lncRNAs in one or multiple contexts using the categories and in the header line of expression capacity table. Furthermore, the “Chart” enables visualization of expression level distribution among all the biological conditions. Each gene id is linked to detailed information page of expression profiles in different contexts.
3.6 Query lncRNA-mRNA interactions in LncExpDB
You can visualize all lncRNA-mRNA interactions in the “Interactions” page, which includes the detail information of lncRNAs-mRNA pairs, pearson correlation coefficient value, p values and distance. The “search by” tab allows you to narrow down the results according to gene of your interest. Each gene id is linked to detailed information page of expression profiles in different contexts.
3.7 Download data in LncExpDB
The “Downloads” page contains all the files that you can download such as: i) reference gene model for RNA-seq analysis, ii) expression profiles, iii) expression levels, iv) featured genes and v) co-expression matrix in various biological contexts.
3.8 Statistic results in LncExpDB
In the page of “Statistics”, you can find and download all statistical analytics results for i) gene annotation statistics, such as lncRNA integration, exon and transcript number distribution and lncRNA classification, ii) expression statistics, including expression profiles and distribution of featured lncRNAs in different biological contexts, and iii) lncRNA-mRNA interaction distribution.
Contact Us
lncwiki@big.ac.cn
Postal Address
The LncExpDB Team
National Genomics Data Center
China National Center for Bioinformation / Beijing Institute of Genomics, Chinese Academy of Sciences
No.1 Beichen West Road
Chaoyang District, Beijing 100101
China