Tool Configuration
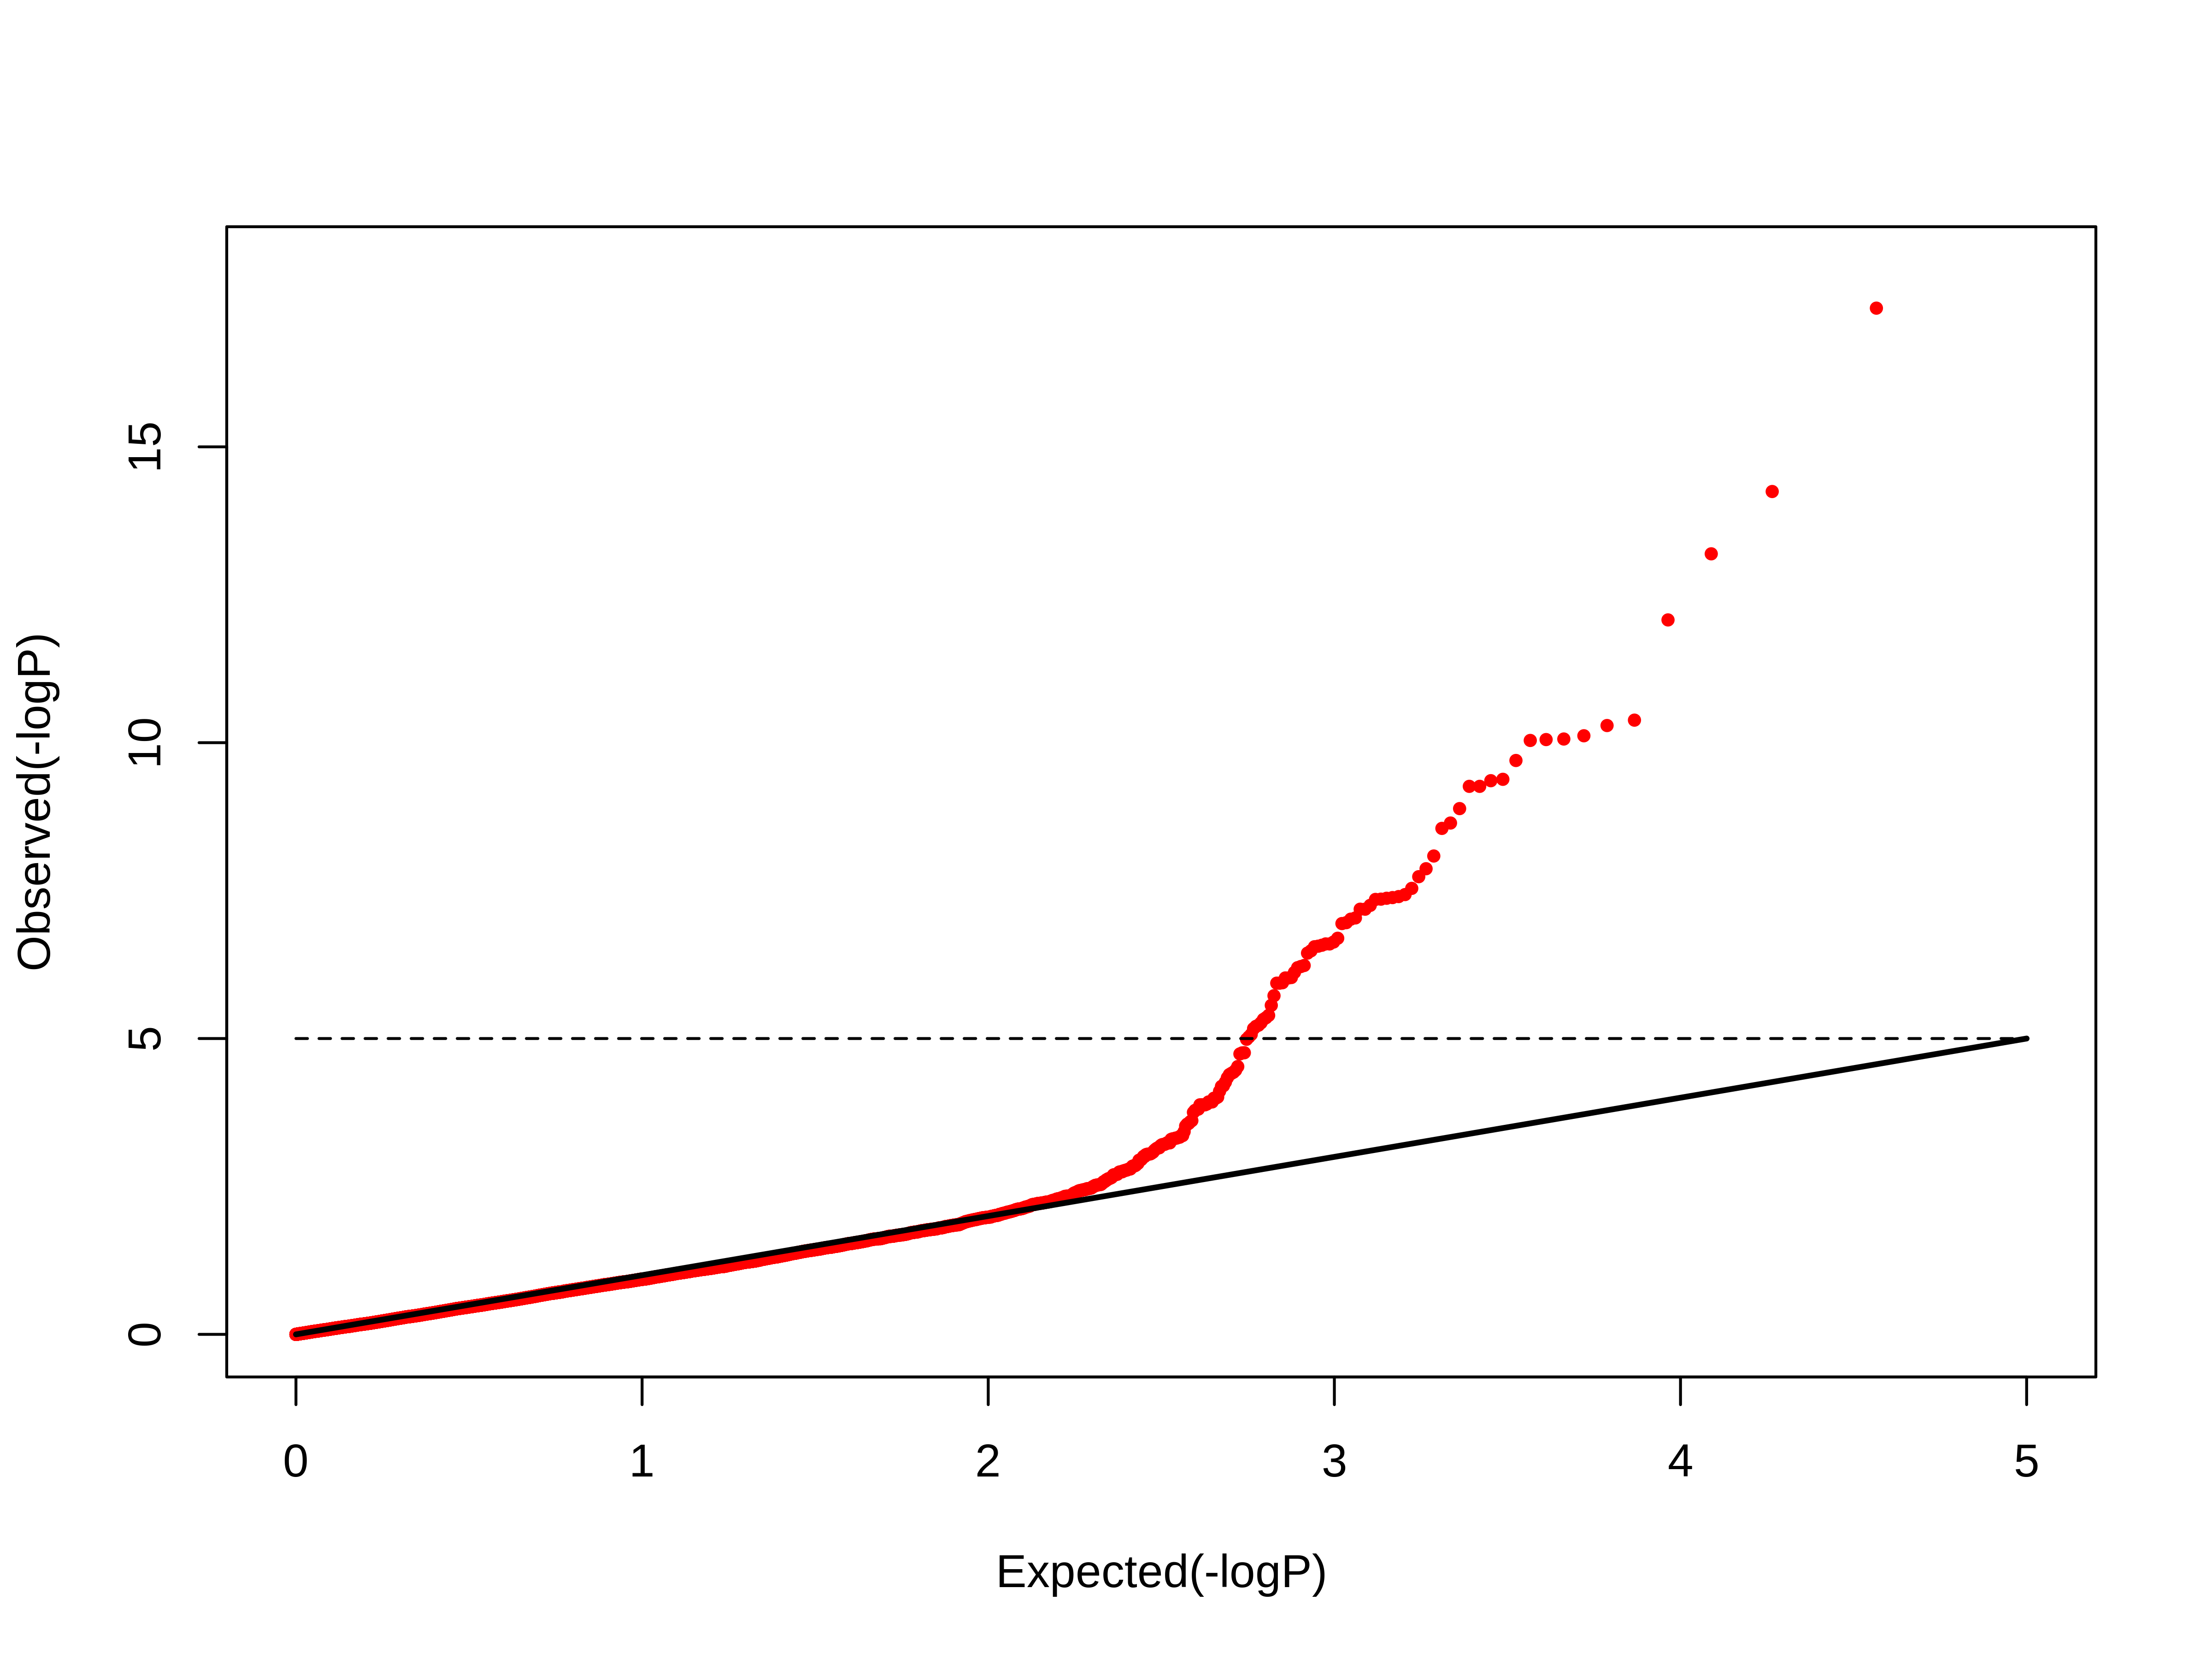
Draw a QQ plot for the given dataset

Data

Dataset

Parameters

References
Wilk, M.B.; Gnanadesikan, R. (1968), "Probability plotting methods for the analysis of data", Biometrika, Biometrika Trust, 55 (1): 1–17, doi:10.1093/biomet/55.1.1, JSTOR 2334448, PMID 5661047
Instructions

Draw a QQ plot for the given dataset

A Q–Q plot (quantile-quantile plot) is a probability plot, which is a graphical method for comparing two probability distributions by plotting their quantiles against each other.

Contributor(s)
Result Preview
Example output and submitted task results are displayed here.
#Runs 302