Home
Category
Visualization
BarBoxComutationDotForestHeatmapHistogramLollipopMafsummaryMaftitvManhattanOncoprintPM-AdiversityPM-comp-corPM-comp-funcPM-comp-taxaPM-DistributionPM-HclusterPM-HeatmapPM-Marker-CorrPM-Marker-RFscorePM-Marker-TestPM-NetworkPM-PcaPM-PcoaPM-plot-taxaQ-QSurvivalUpsetVenn
Sequence alignment
BLASTDotmatcherDotpathDottupNeedlePM-BdiversityPM-extract-rnaPM-parallel-metaPolydotWater
RNA Expression
Bulk RNA-seq Data AnalysisCancer Alternative Splicing AnalysisCCLHunterCIRI-deepCIRI3Cross-disease analysisDisease predictionEditing site annotationEditing site identificationEditingFactorDetectorFunGenGene-disease network constructionNCSelPredRNA-seq AnalysisSingle-cell RNA-seq Data AnalysisSPIRALTIVar diffTIVar predictVisualization of scRNA-seq Data Analysis Results
Variome analysis
BarcodeBLASTBarcodeFindereasyGWASExpPatternGeneFinderHaplotype analysisHapMapHapSnapLeadSNPFinderRice Varieties IdentificationRice Yield EstimationSeqFetchVersionMapWheat Head Estimation
Epigenome analysis
Age PredictorBS-RNAComparative analysis in nucleosomesDMR AnnotationDMR ToolkitEnrichment & AnnotationEnrichment analysis in nucleosome occupancyEWAS Network VisualizationGMQNIDMPLollipop PlotterMRAS
Long non-coding RNA
ClassificationFunctional PredictionID conversionLGClncbook-BLASTLncBot
Virus
COVID-19 genome variation annotationCOVID-19 haplotype analysisDenovo AssemblyEvolutionary treeFastq-to-VariantsGenealogy and Evolutionary AnalysisGenome AnnotationGenome TracingMcANMonkeypox virus genome variation annotationMonkeypox virus genome variation identificationPangolin COVID-19 Lineage AssignerSeqQCVENASVISTA
Single-cell omics
BroCOLICell Type ComparatorCell Type PredictorFGOTGOTSCSESSpaMITACOSUCASpatial
Image Processing
Image CroppingImage DenoisingImage FlippingImage PartitioningImage Resizing
Others
APAcatcherComposition analysisCross-model analysisCross-species analysisCross-stages analysisHomolog FinderLUTLSRSMIAncRNA-eQTLPM-predict-func
User Manual
Sequence alignment
BLASTDotmatcherDotpathDottupNeedlePM-BdiversityPM-extract-rnaPM-parallel-metaPolydotWater
Home Sequence alignment
Dottup
Program
Dottup
Dottup

Data

Sequence A
Example file
Sequence B
Example file

Parameters

false
True
False
svg
SVG
PostScript
References
Rice P., Longden I. and Bleasby A. EMBOSS: The European Molecular Biology Open Software Suite. Trends in Genetics. 2000 16(6):276-277
Instructions

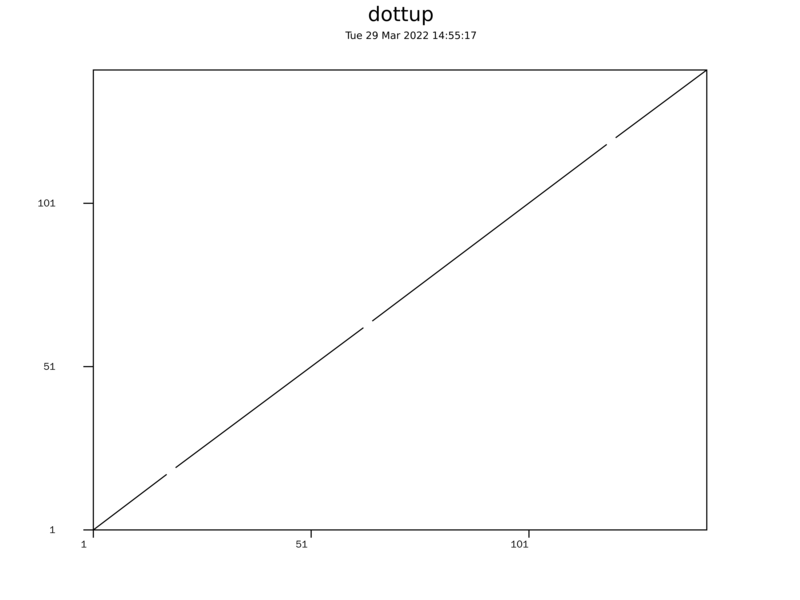
Display a wordmatch dotplot of two sequences

A dotplot is a graphical representation of the regions of similarity between two sequences.
The two sequences are placed on the axes of a rectangular image and (in the simplest forms of dotplot) wherever there is a similarity between the sequences a dot is placed on the image.

Where the two sequences have substantial regions of similarity, many dots align to form diagonal lines. It is therefore possible to see at a glance where there are local regions of similarity as these will have long diagonal lines. It is also easy to see other features such as repeats (which form parallel diagonal lines), and insertions or deletions (which form breaks or discontinuities in the diagonal lines).

dottup looks for places where words (tuples) of a specified length have an exact match in both sequences and draws a diagonal line over the position of these words. This is a fast, but not especially sensitive way of creating dotplots. It is an acceptable method for displaying regions of substantial similarity between two sequences.

Using a longer word (tuple) size displays less random noise, runs extremely quickly, but is less sensitive. Shorter word sizes are more sensitive to shorter or fragmentary regions of similarity, but also display more random points of similarity (noise) and runs slower.

Contributor(s)
Zhenglin Du
bit@big.ac.cn
#Runs
176
Open Result