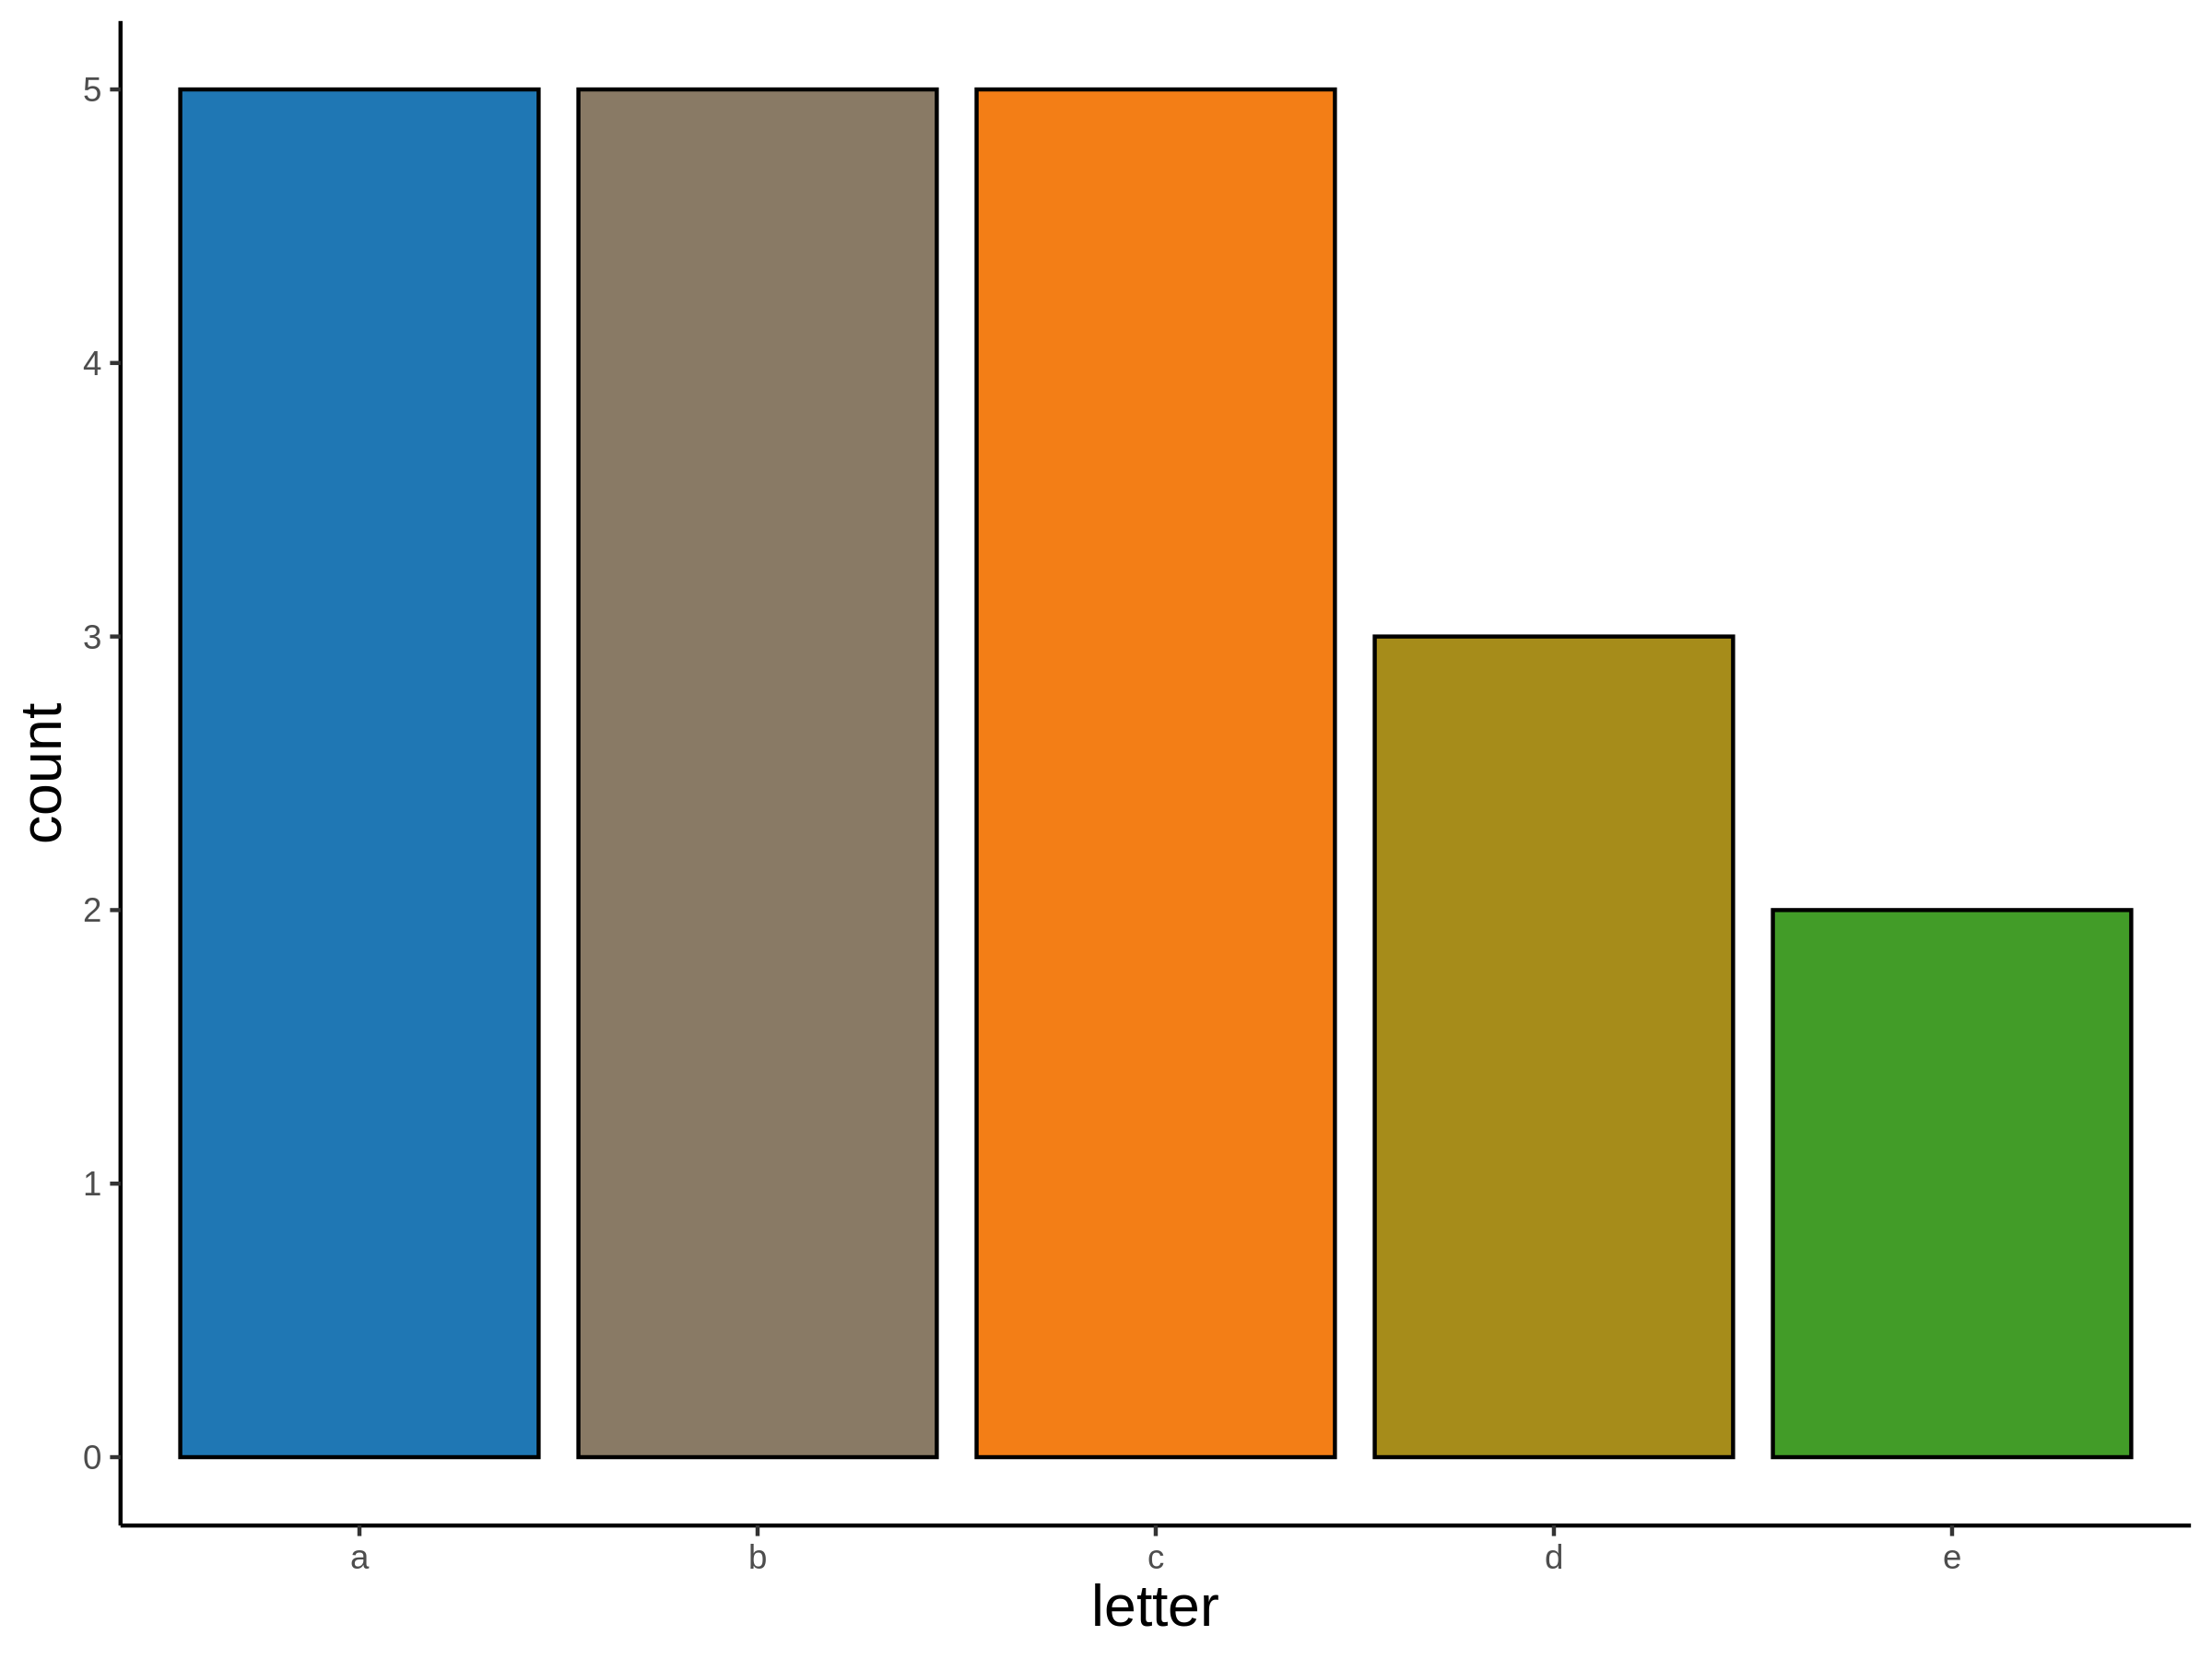
Draw a bar plot for the given dataset

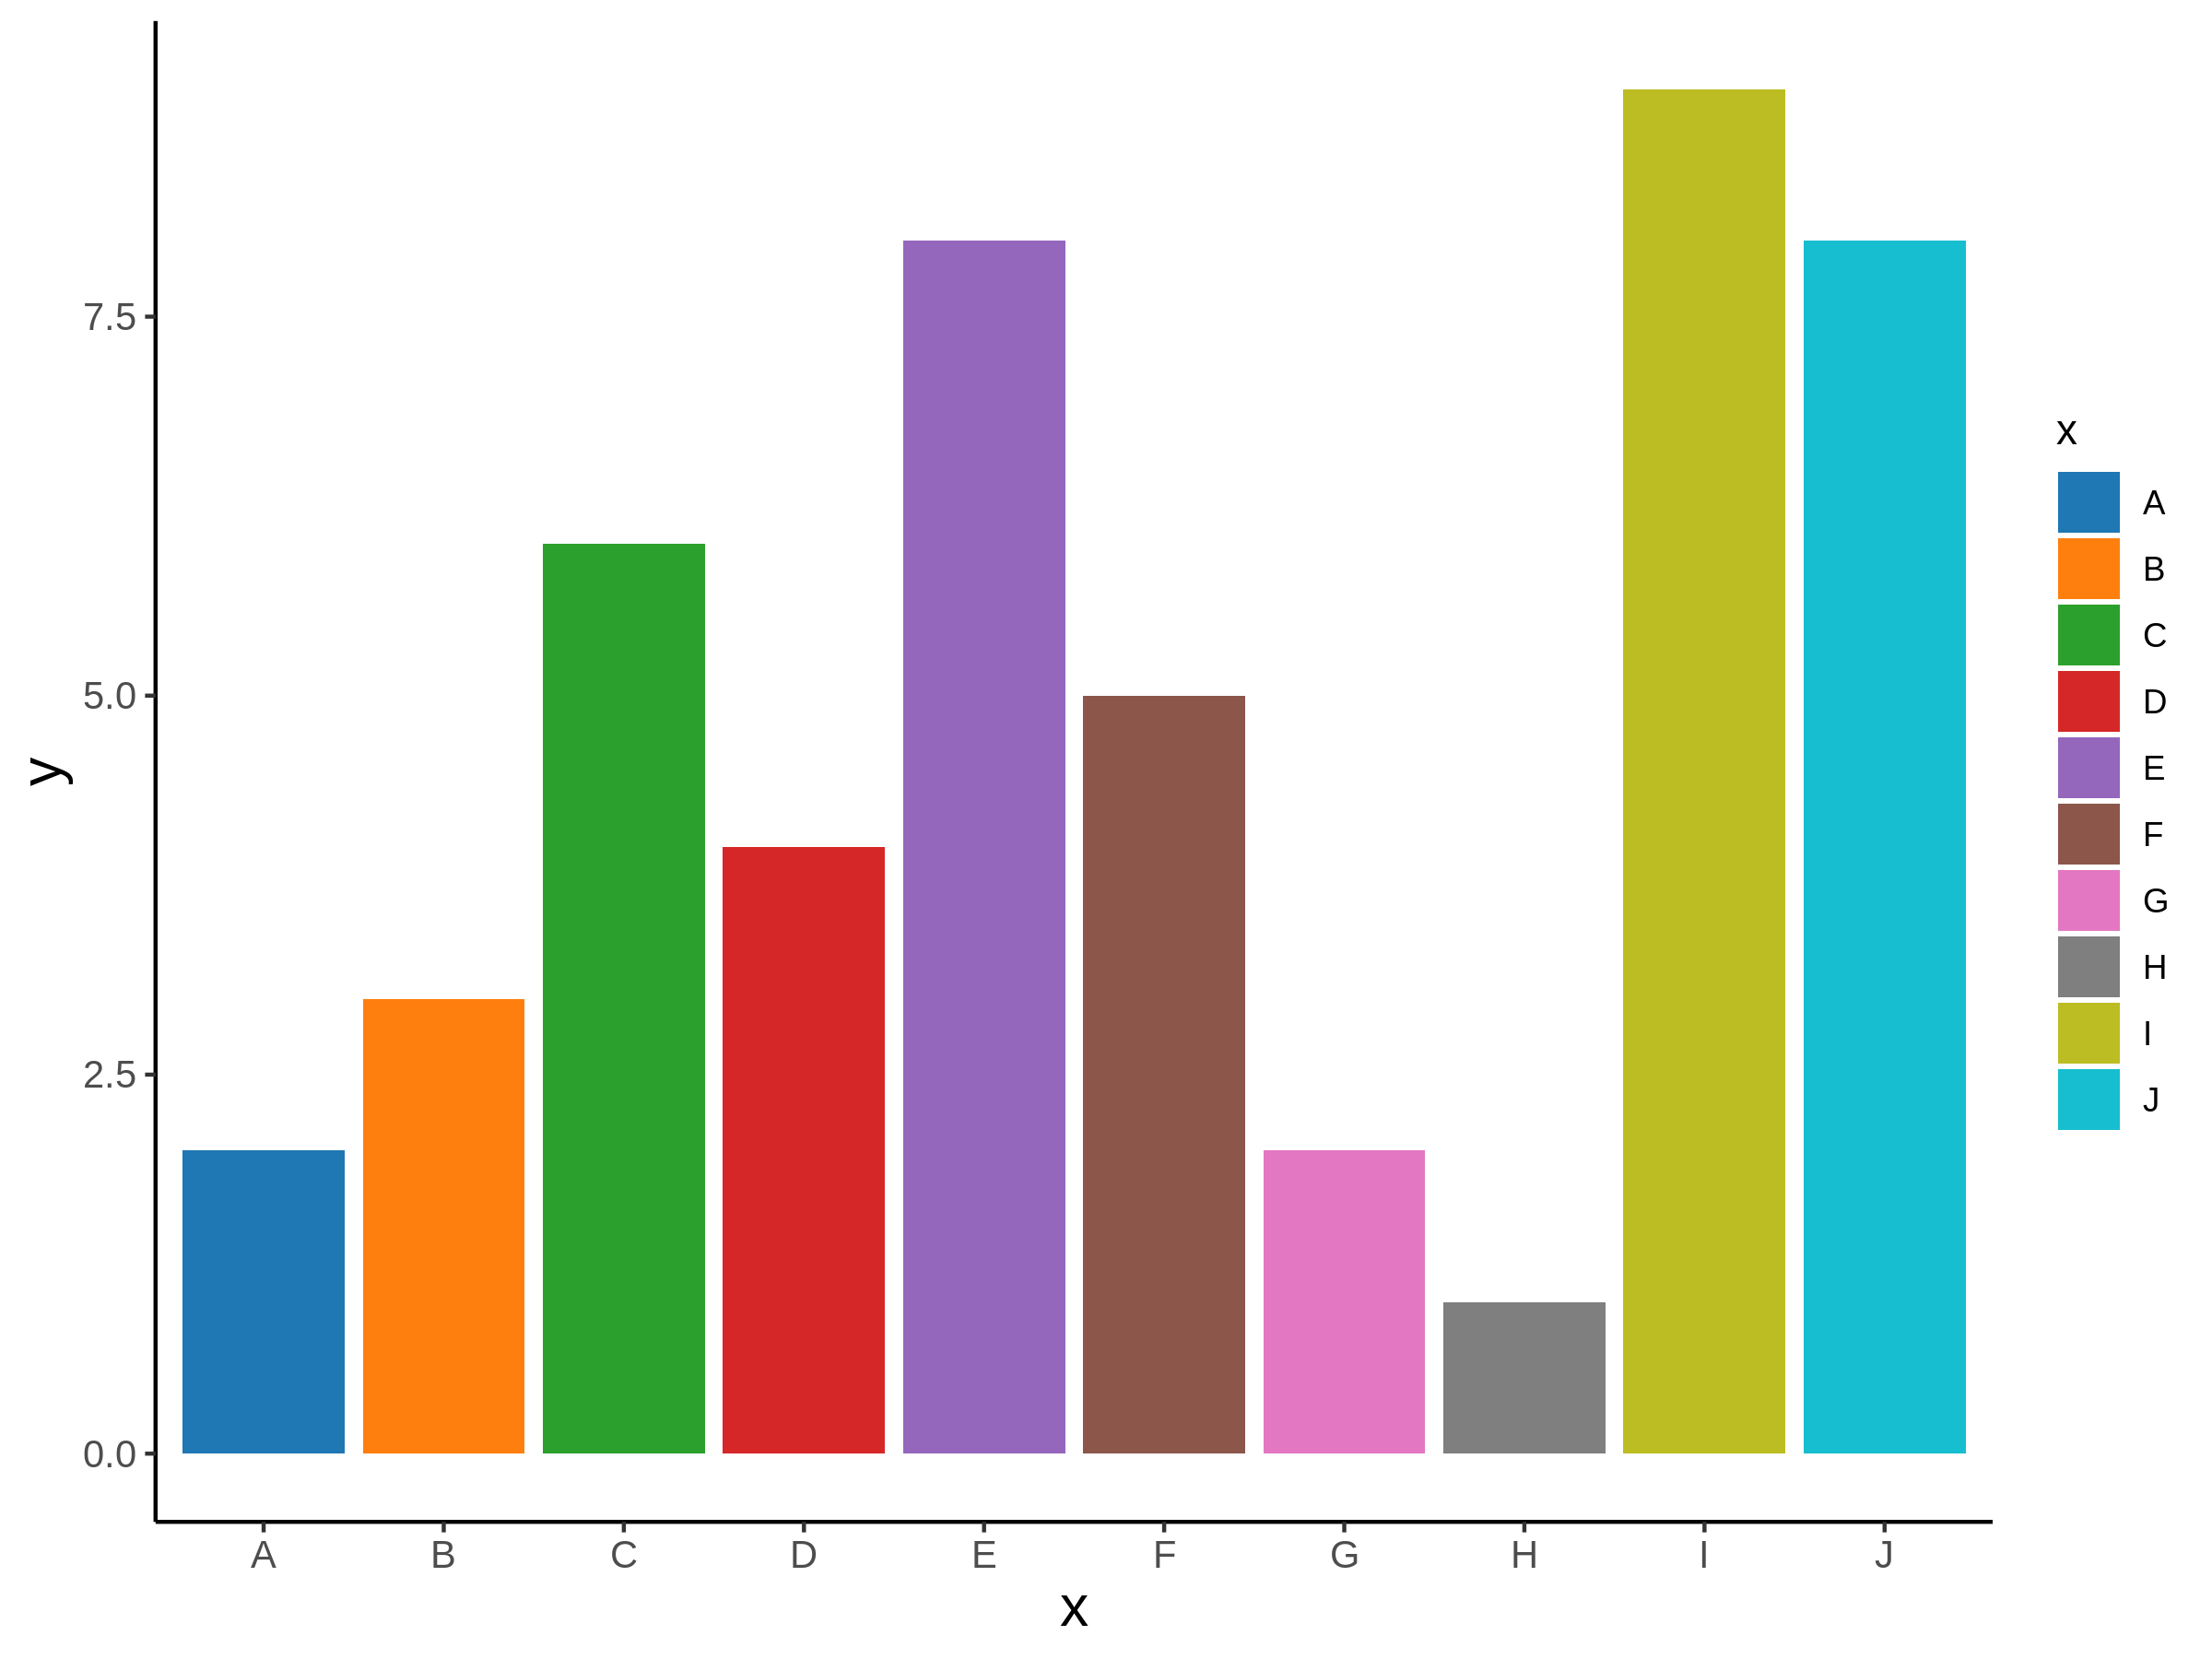
Bar
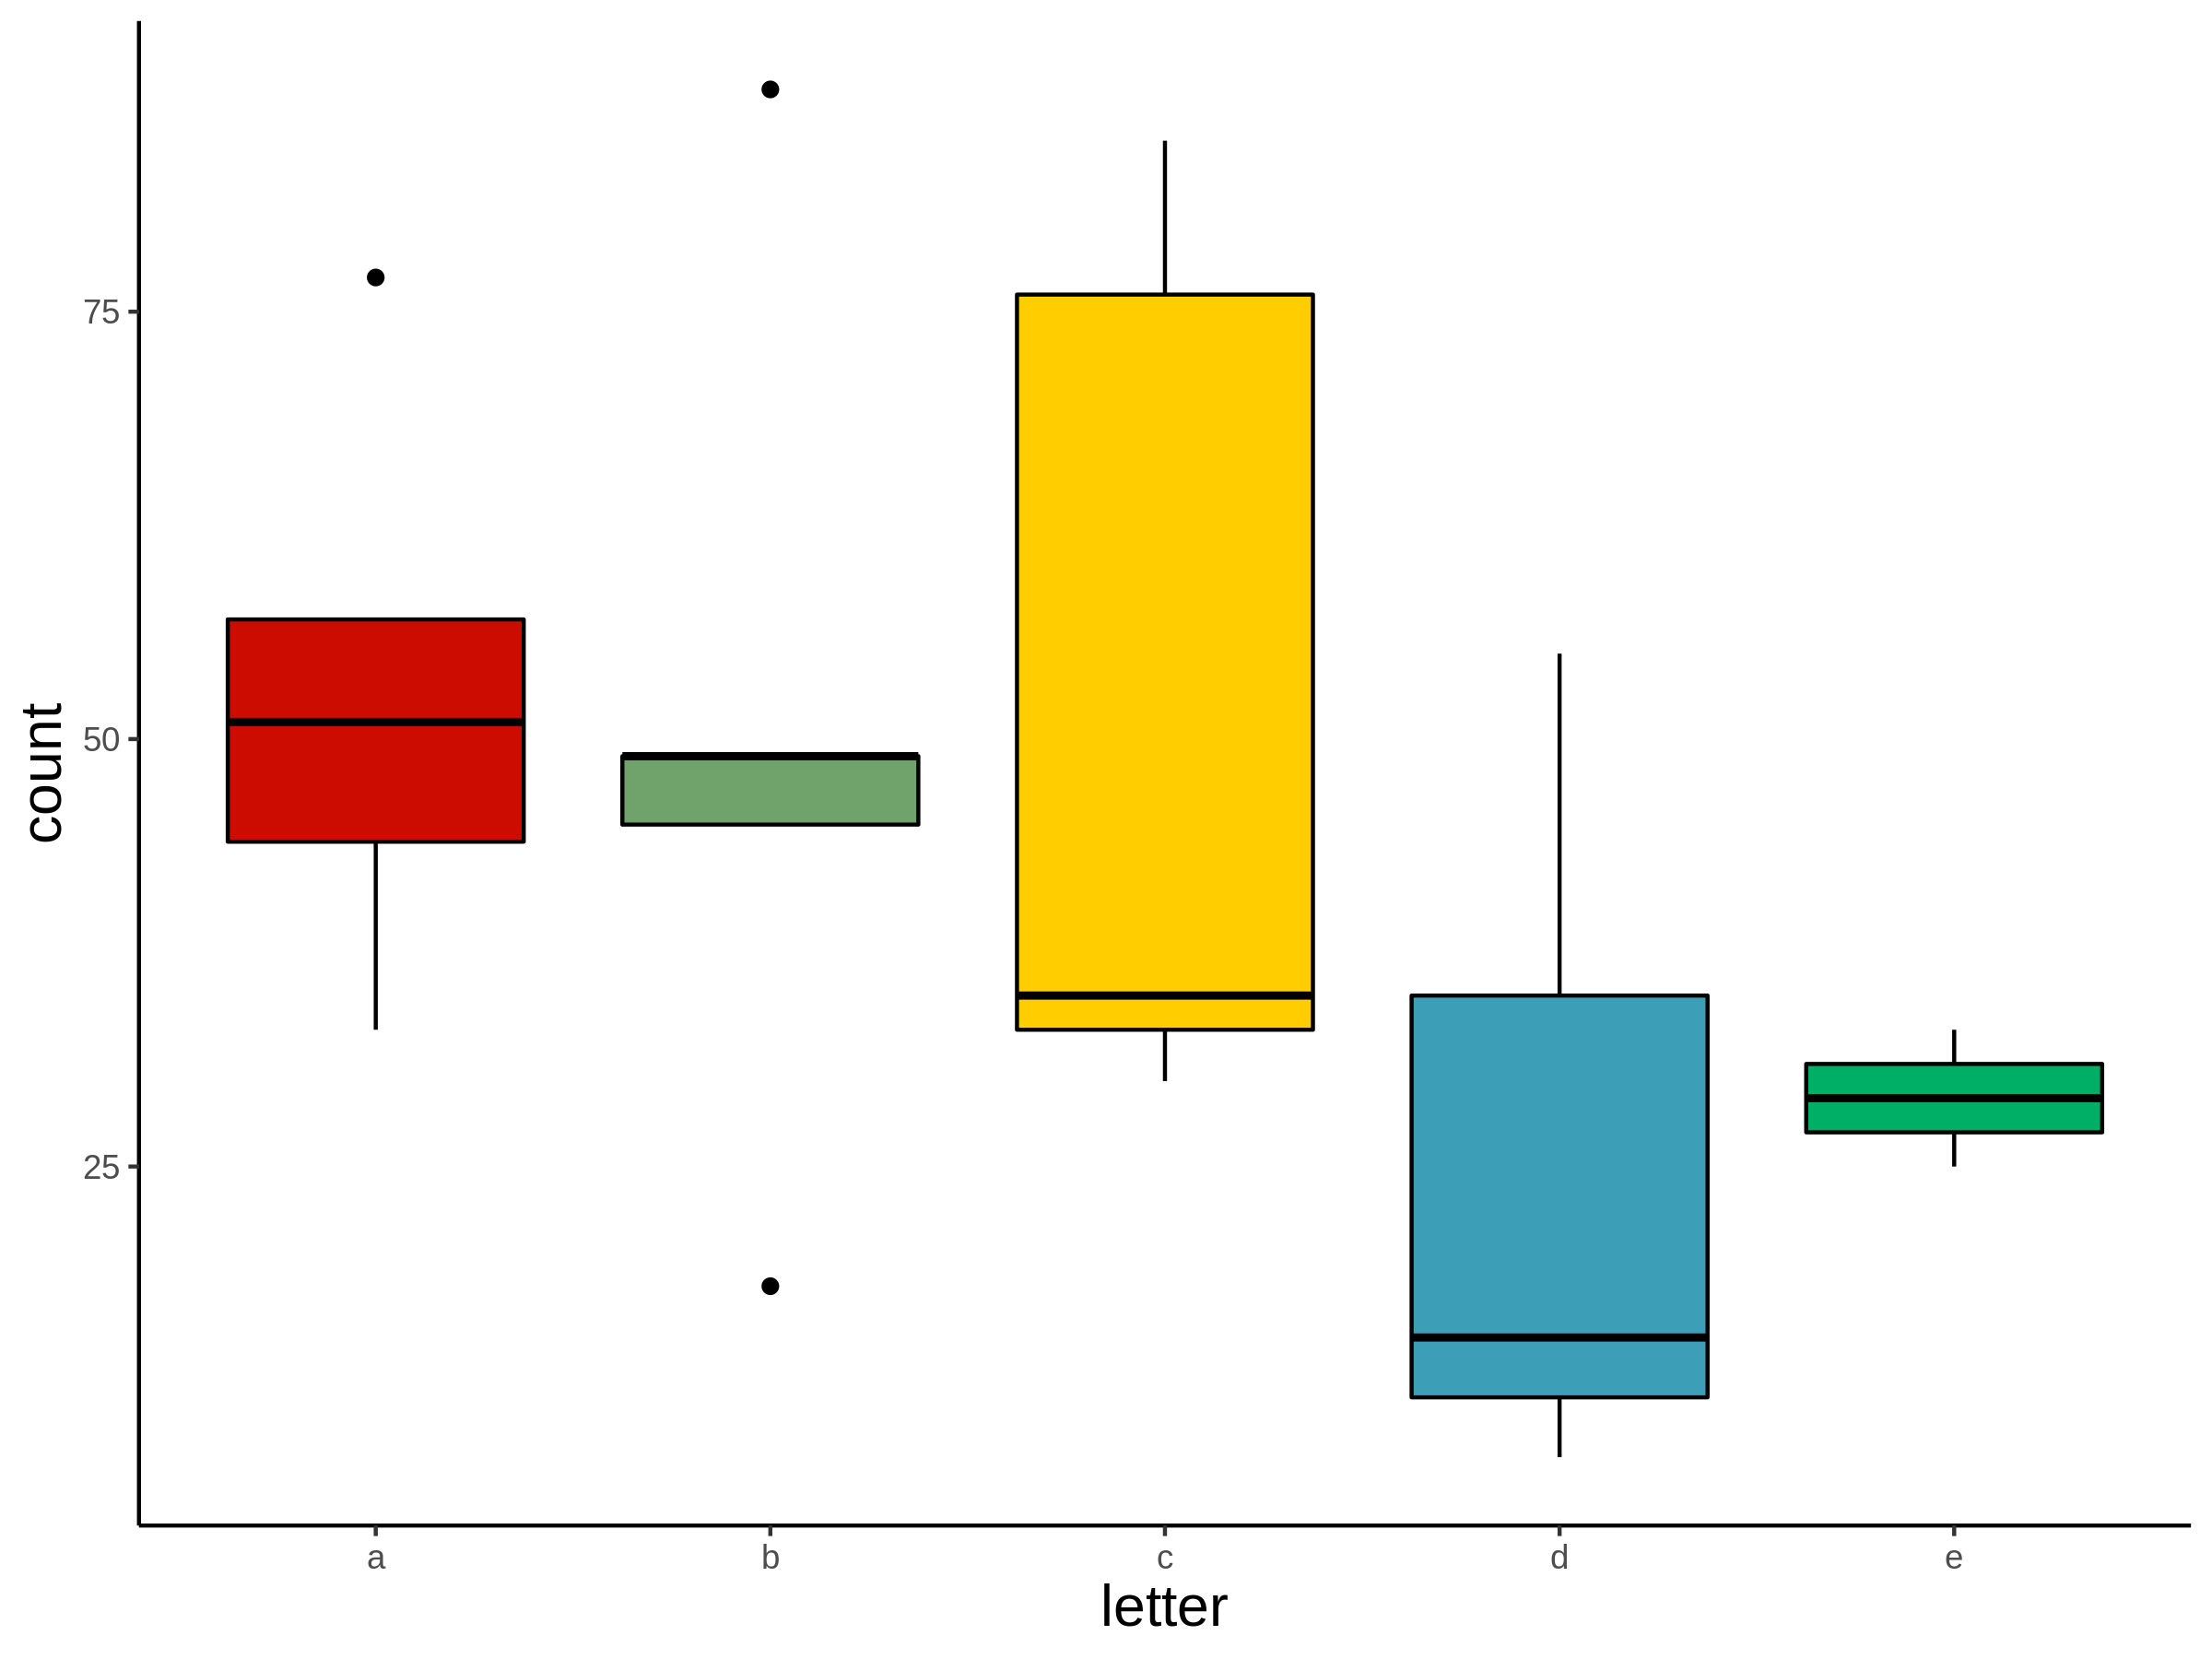
Box
Draw a box plot for the given dataset
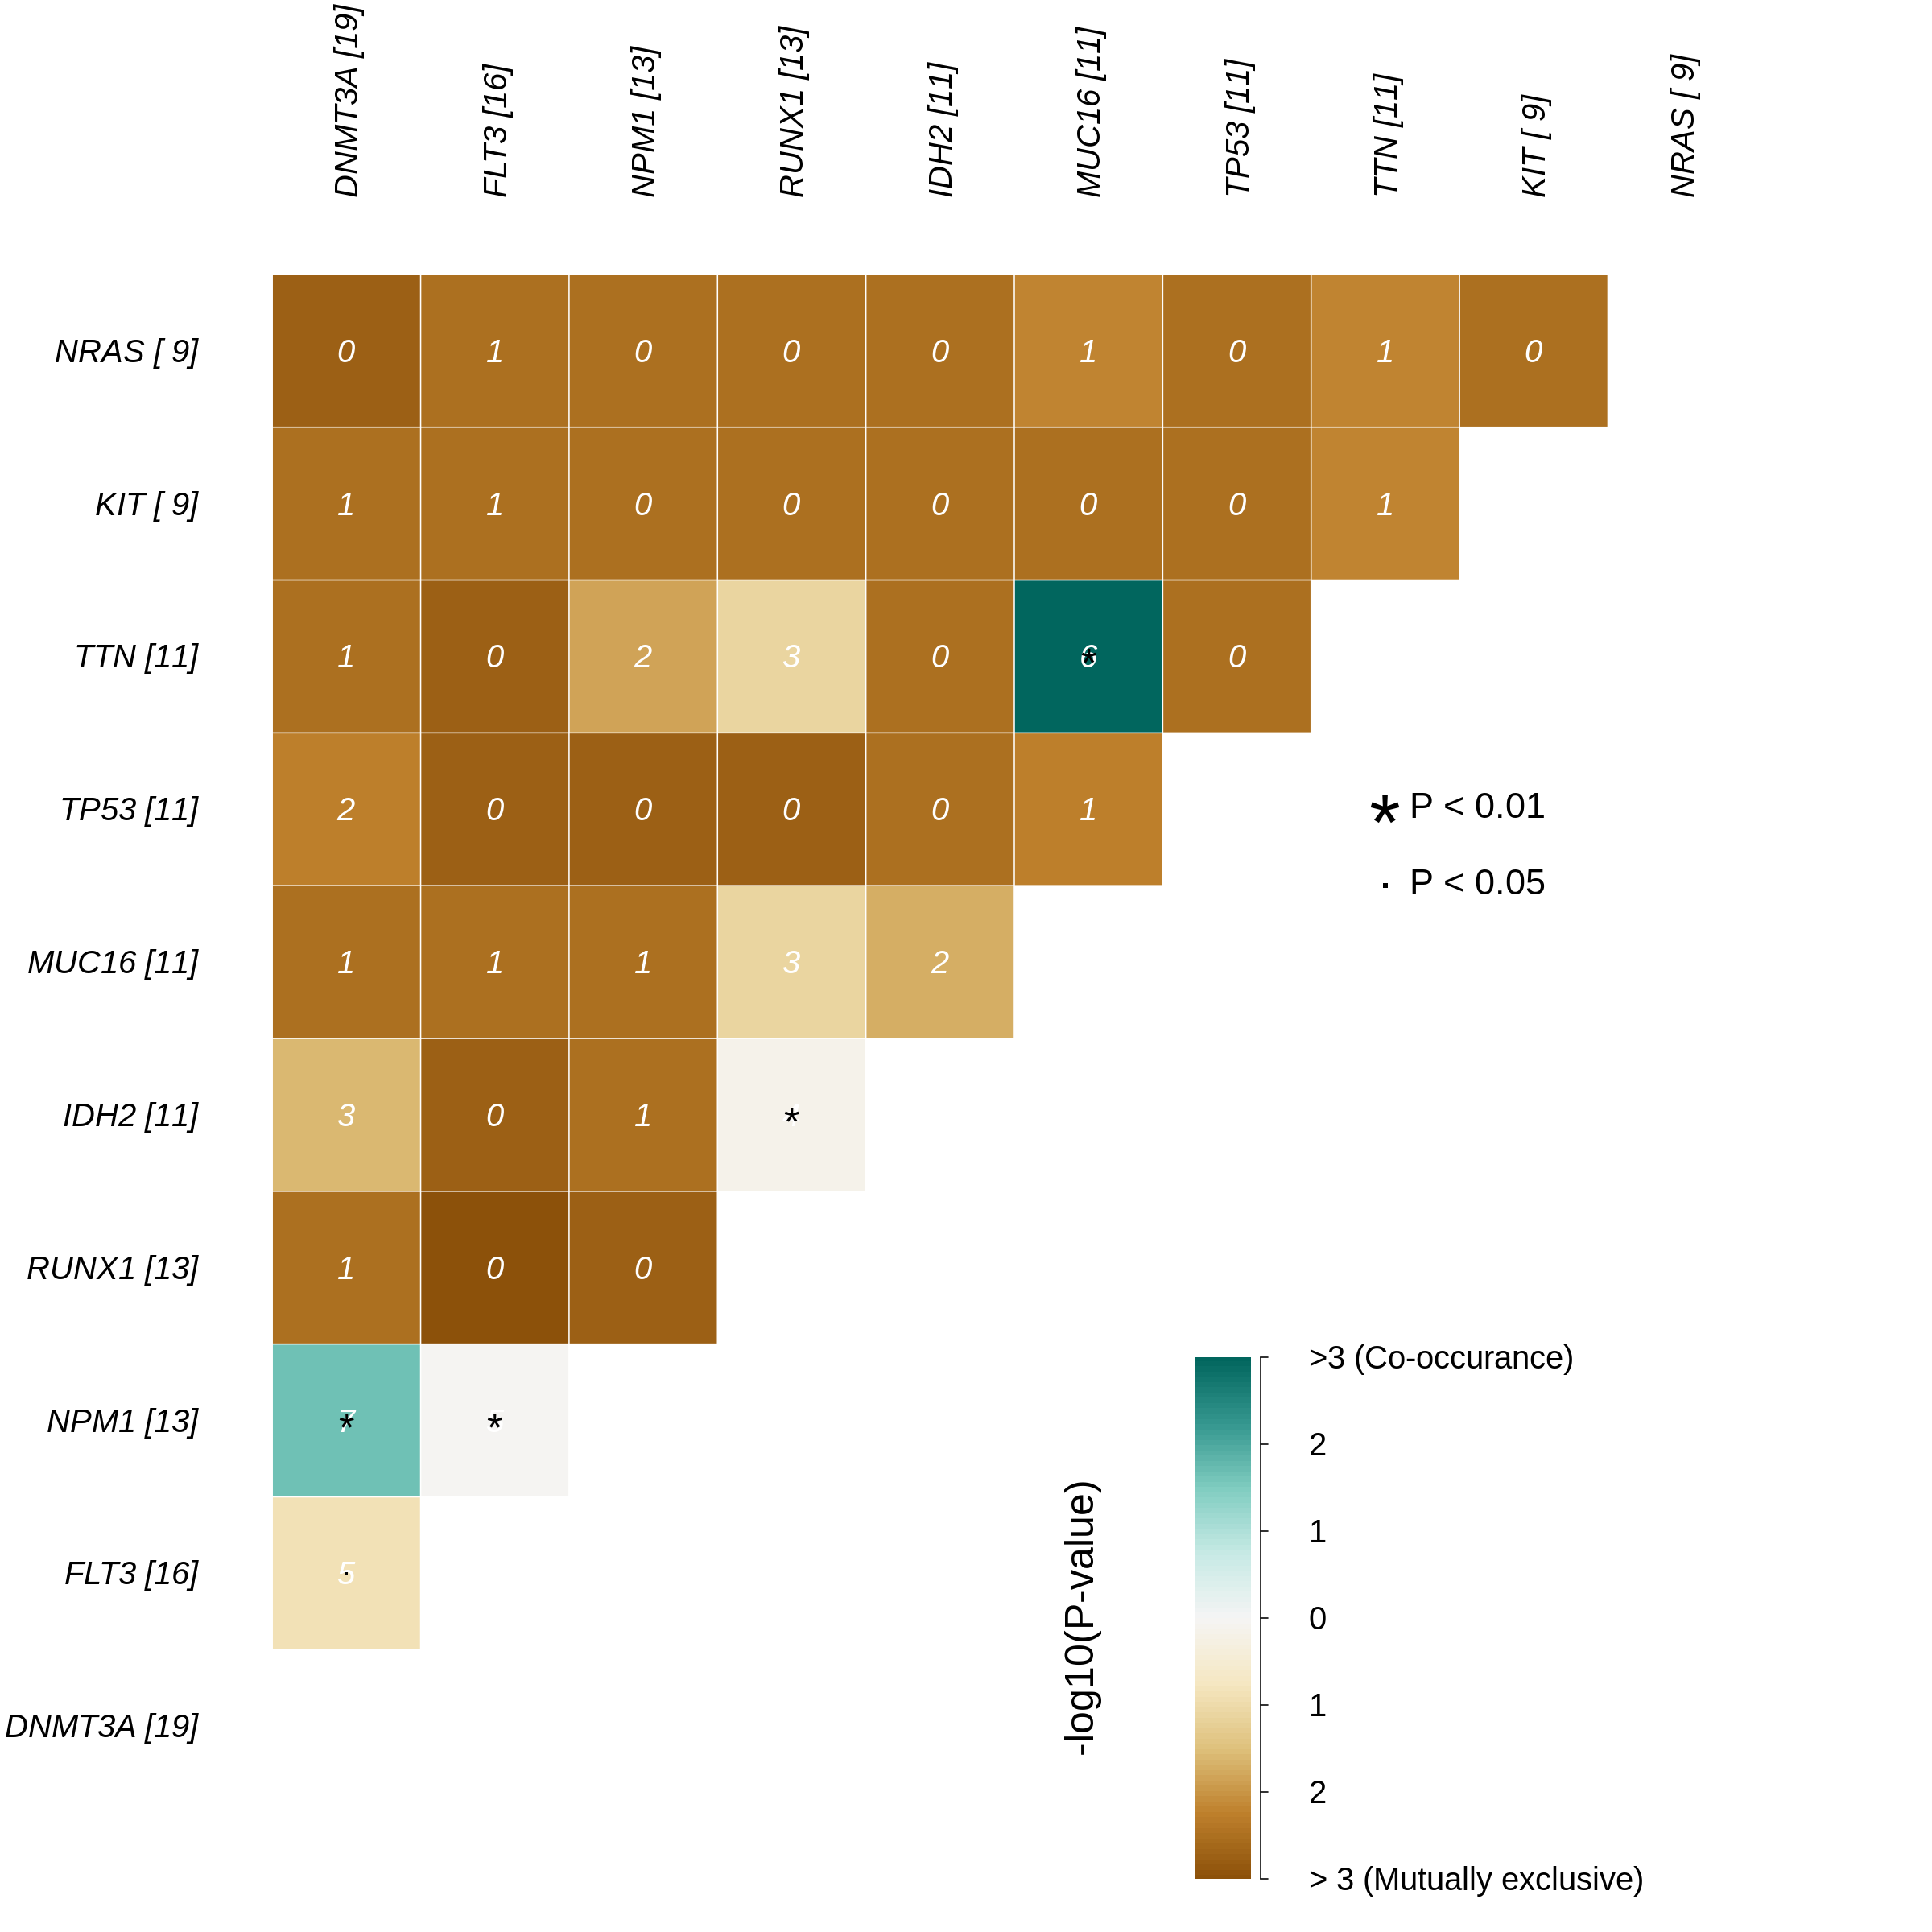
Comutation
Draw a comutation plot for the given dataset
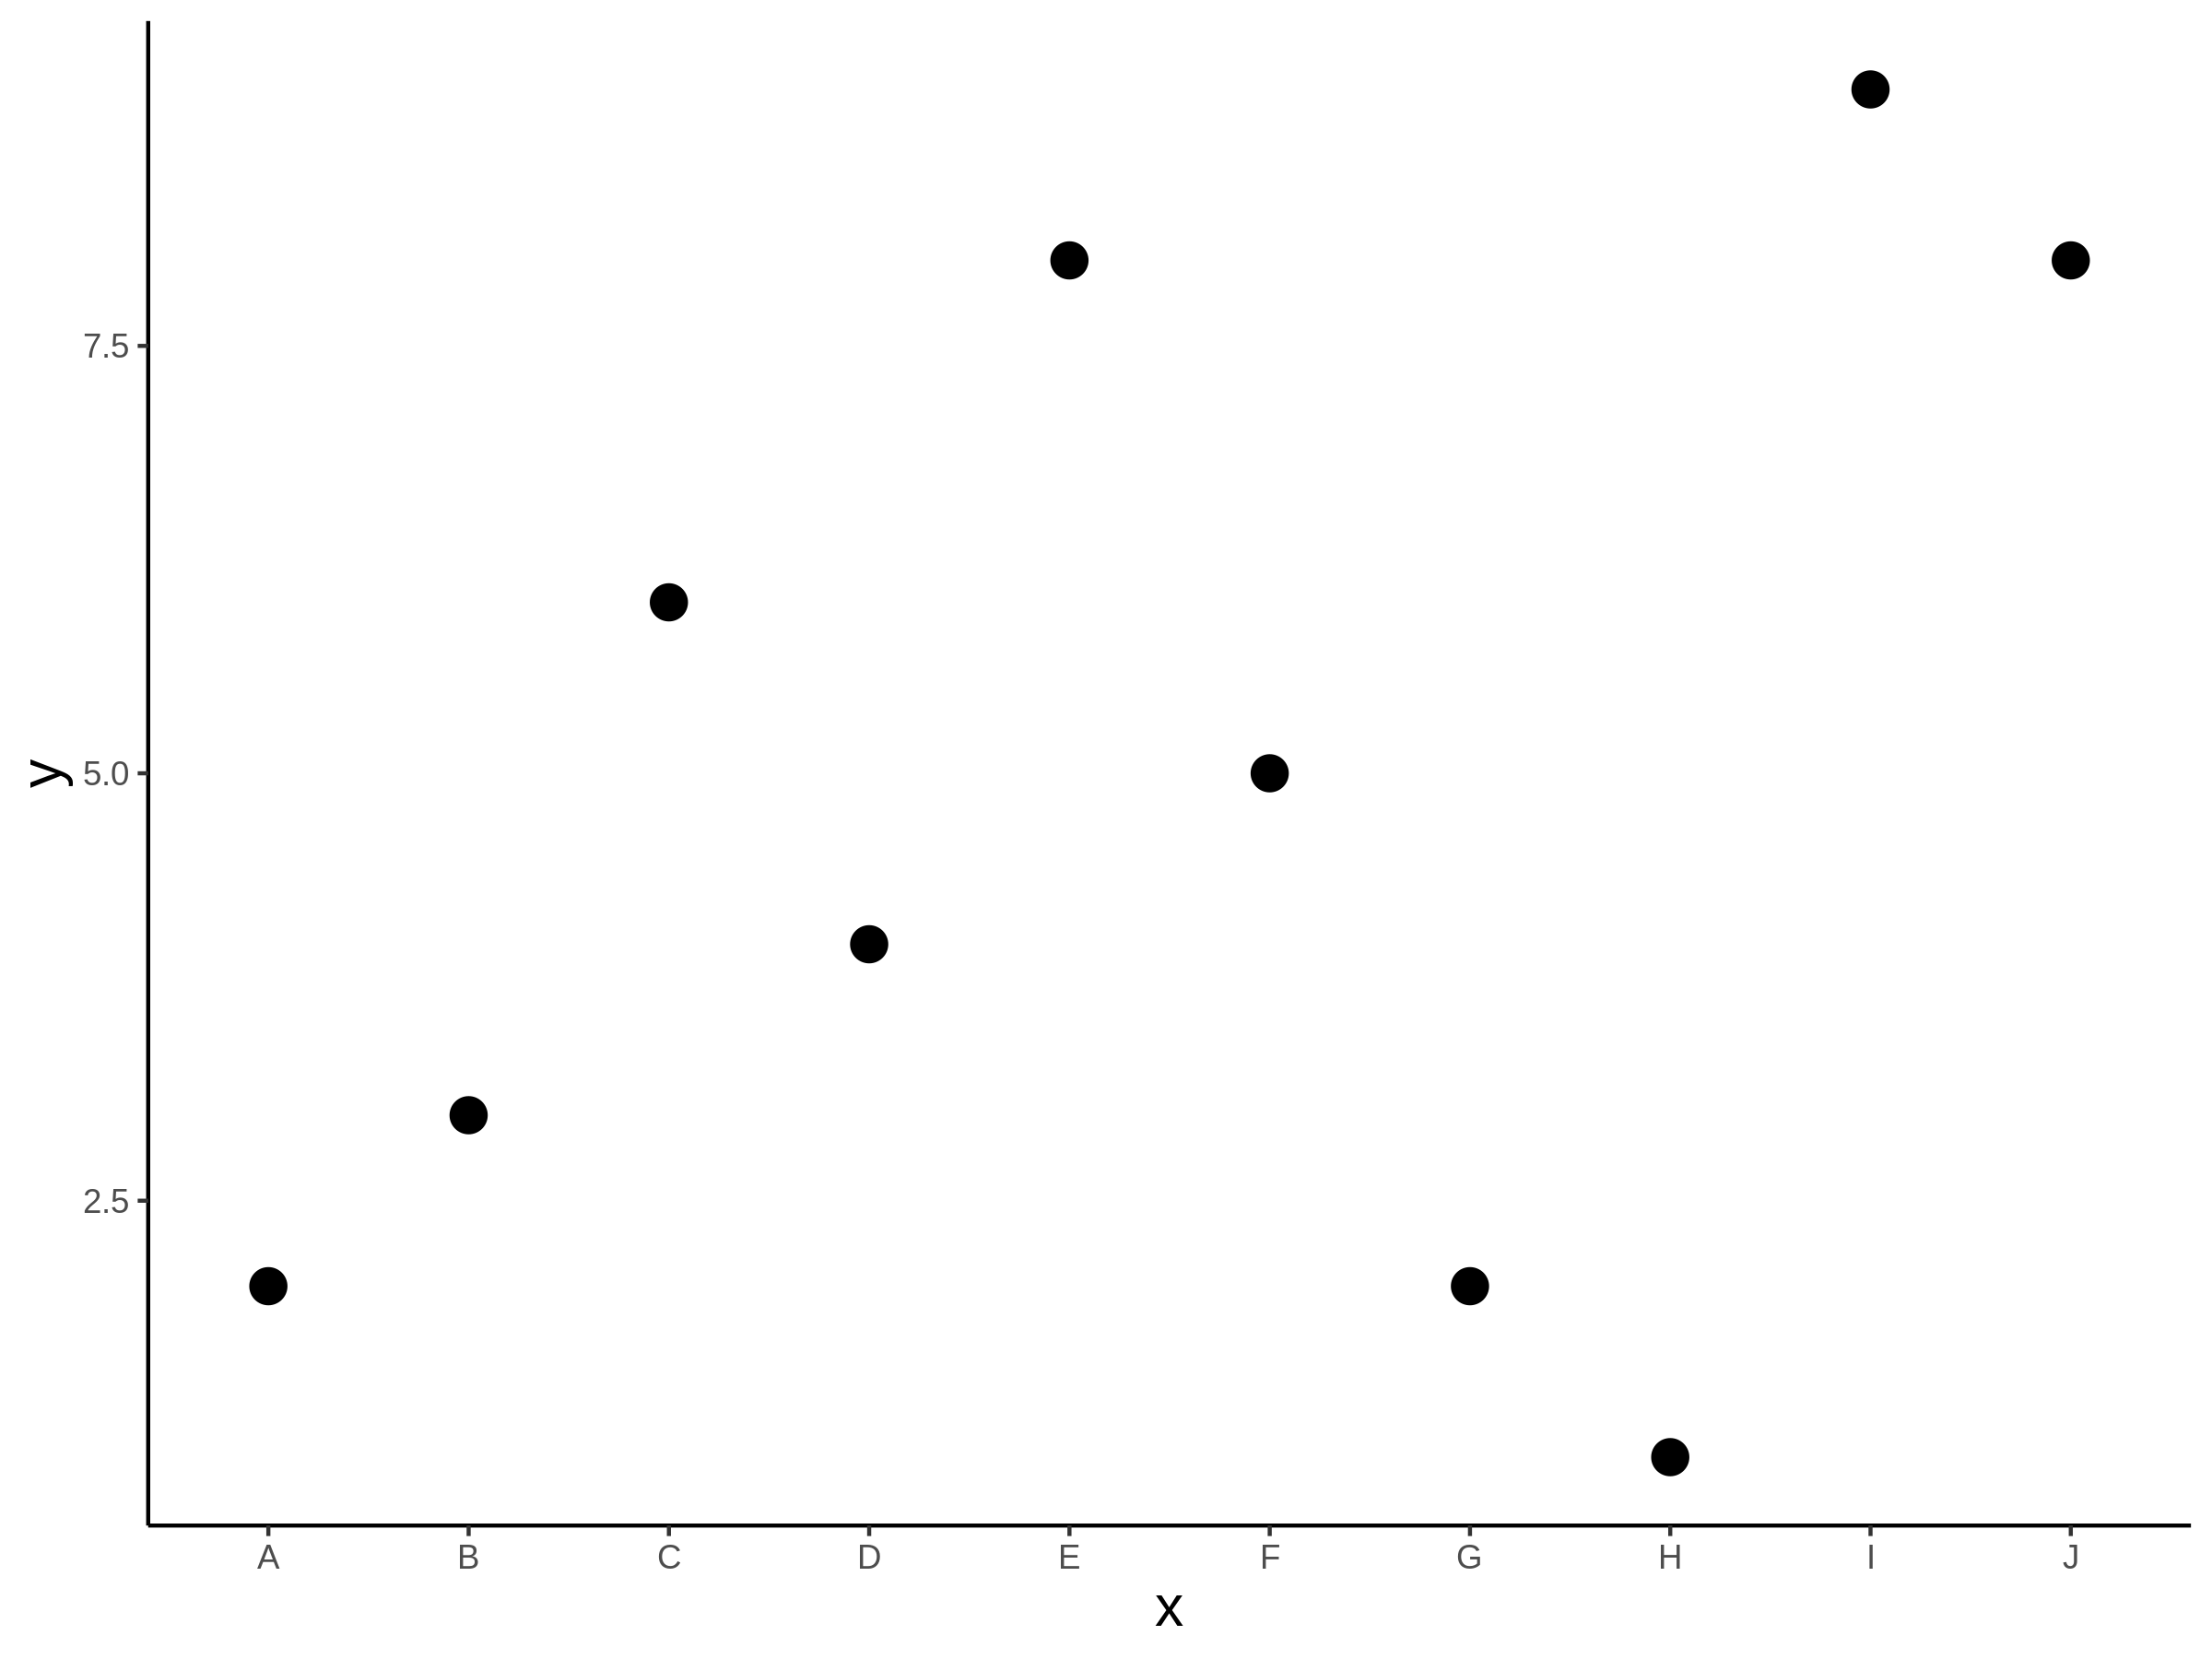
Dot
Draw a dot plot for the given dataset
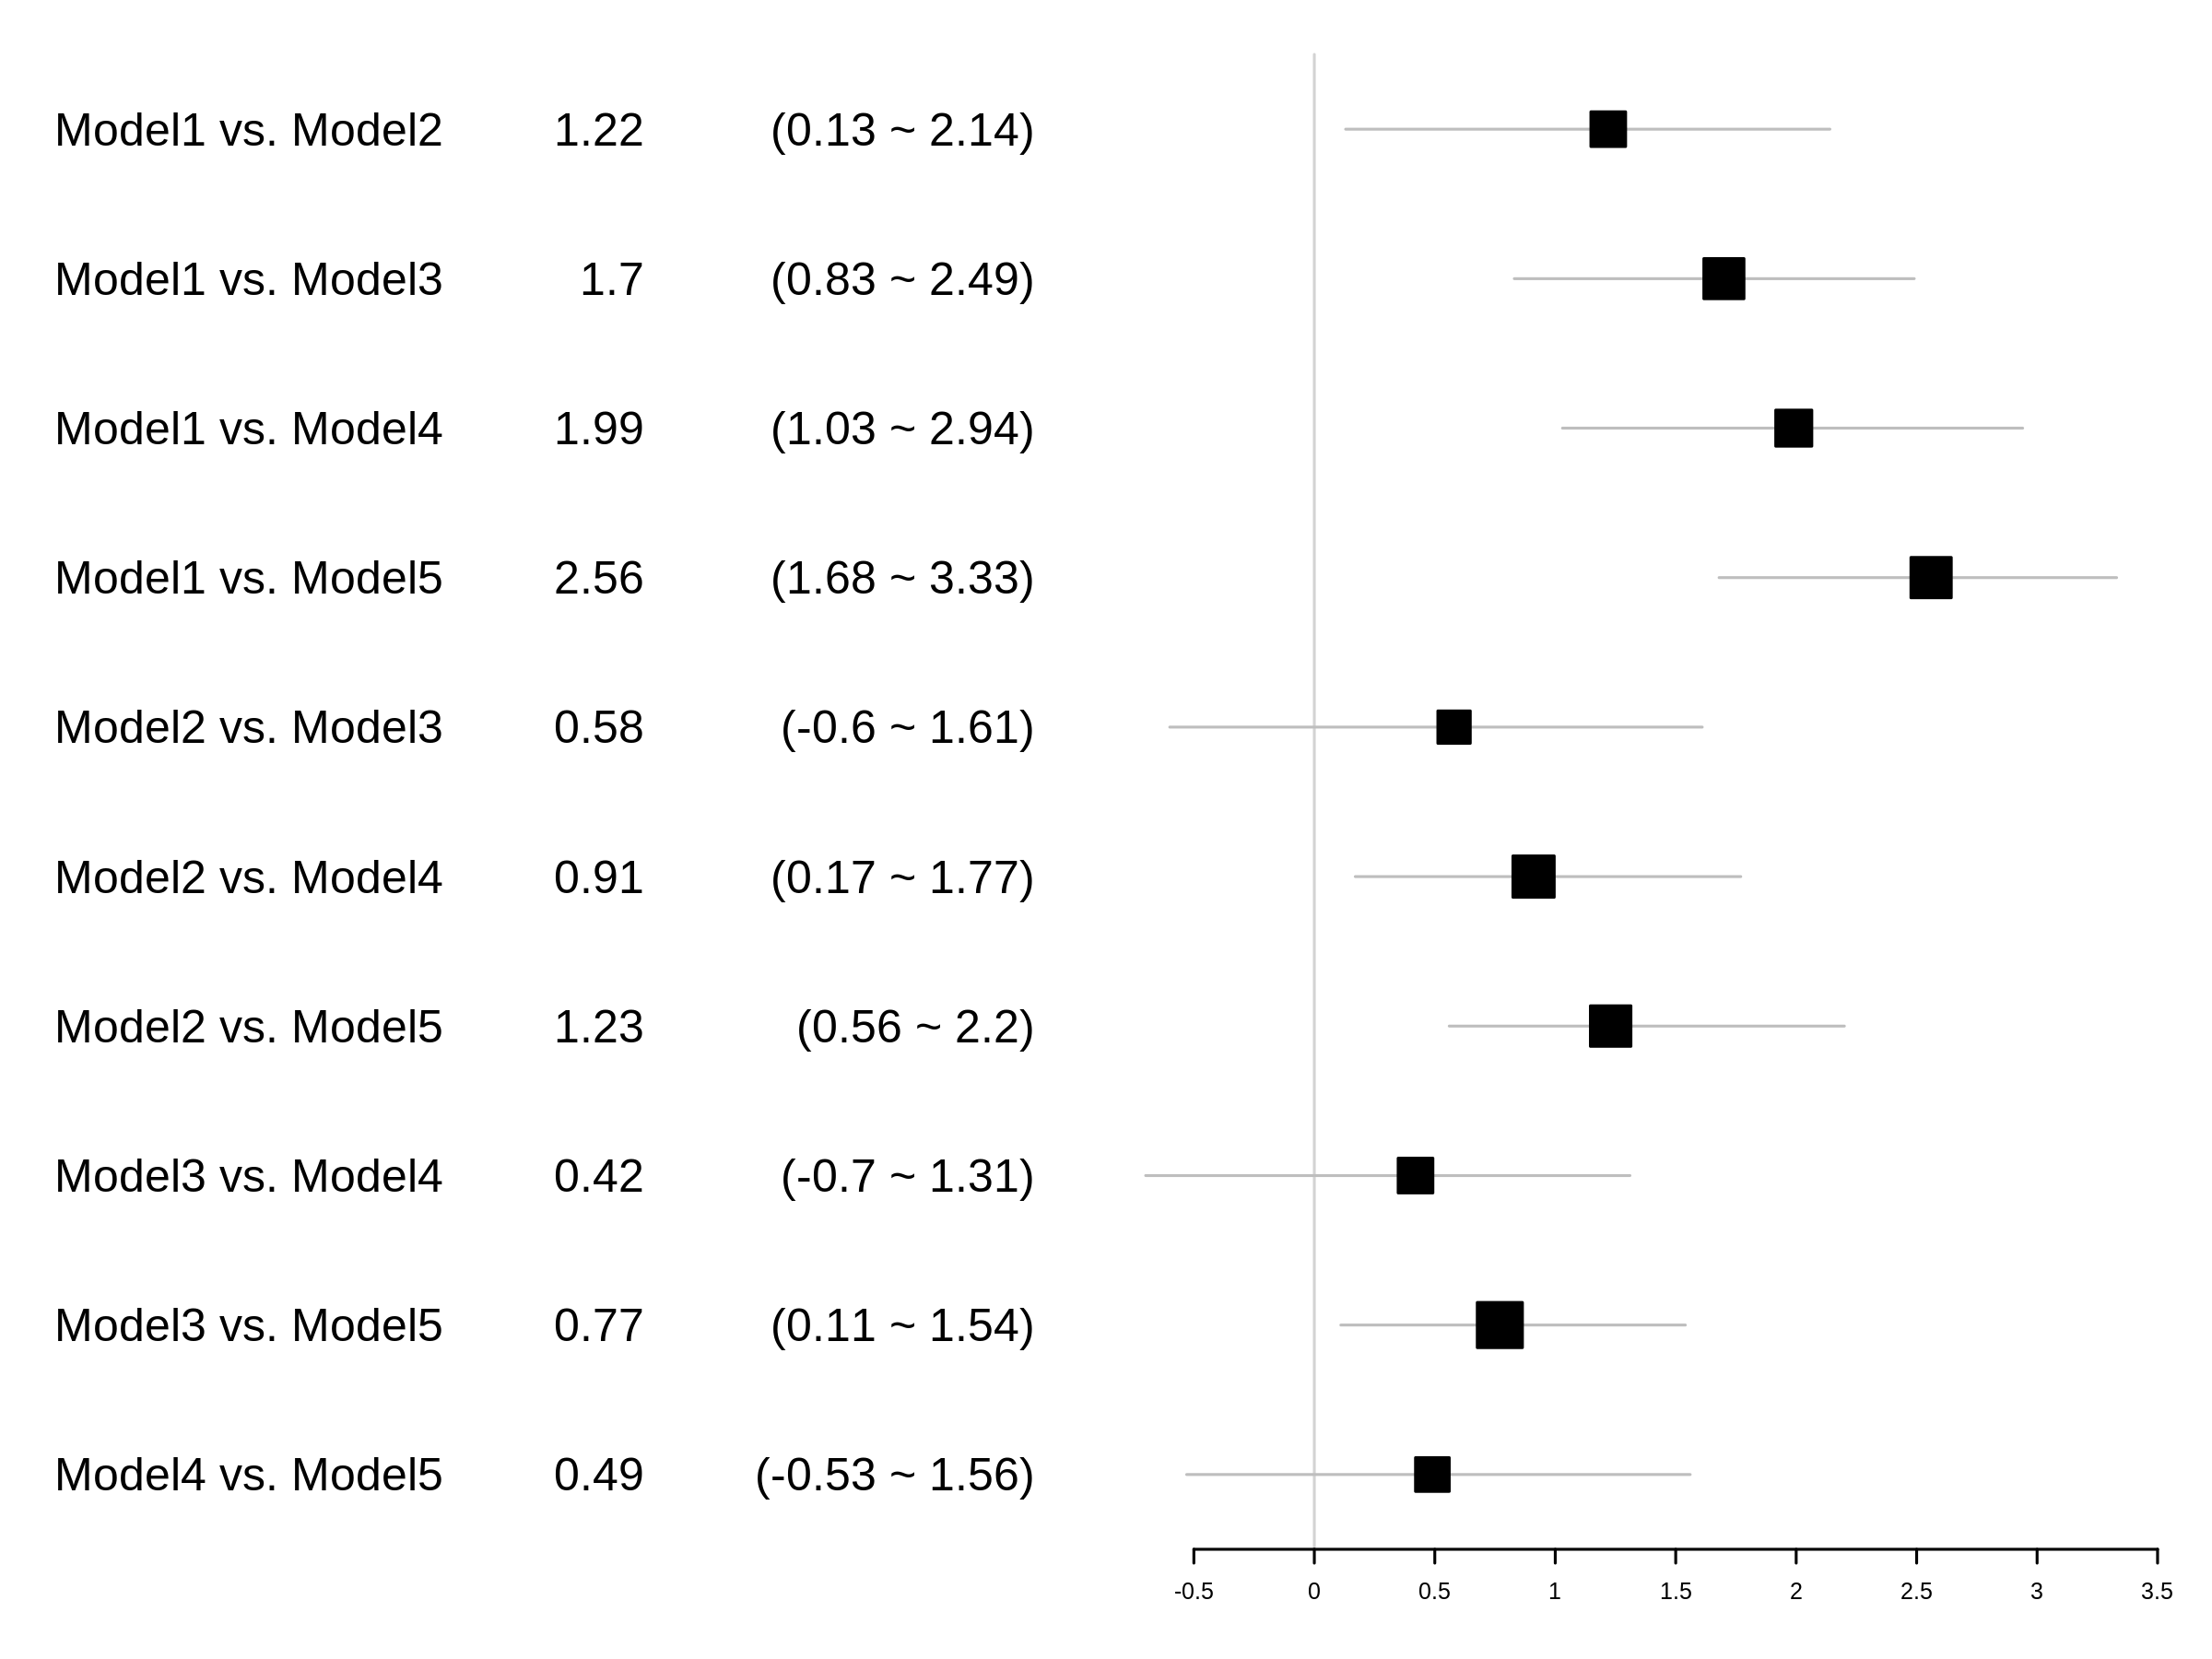
Forest
Draw a forest plot for the given dataset
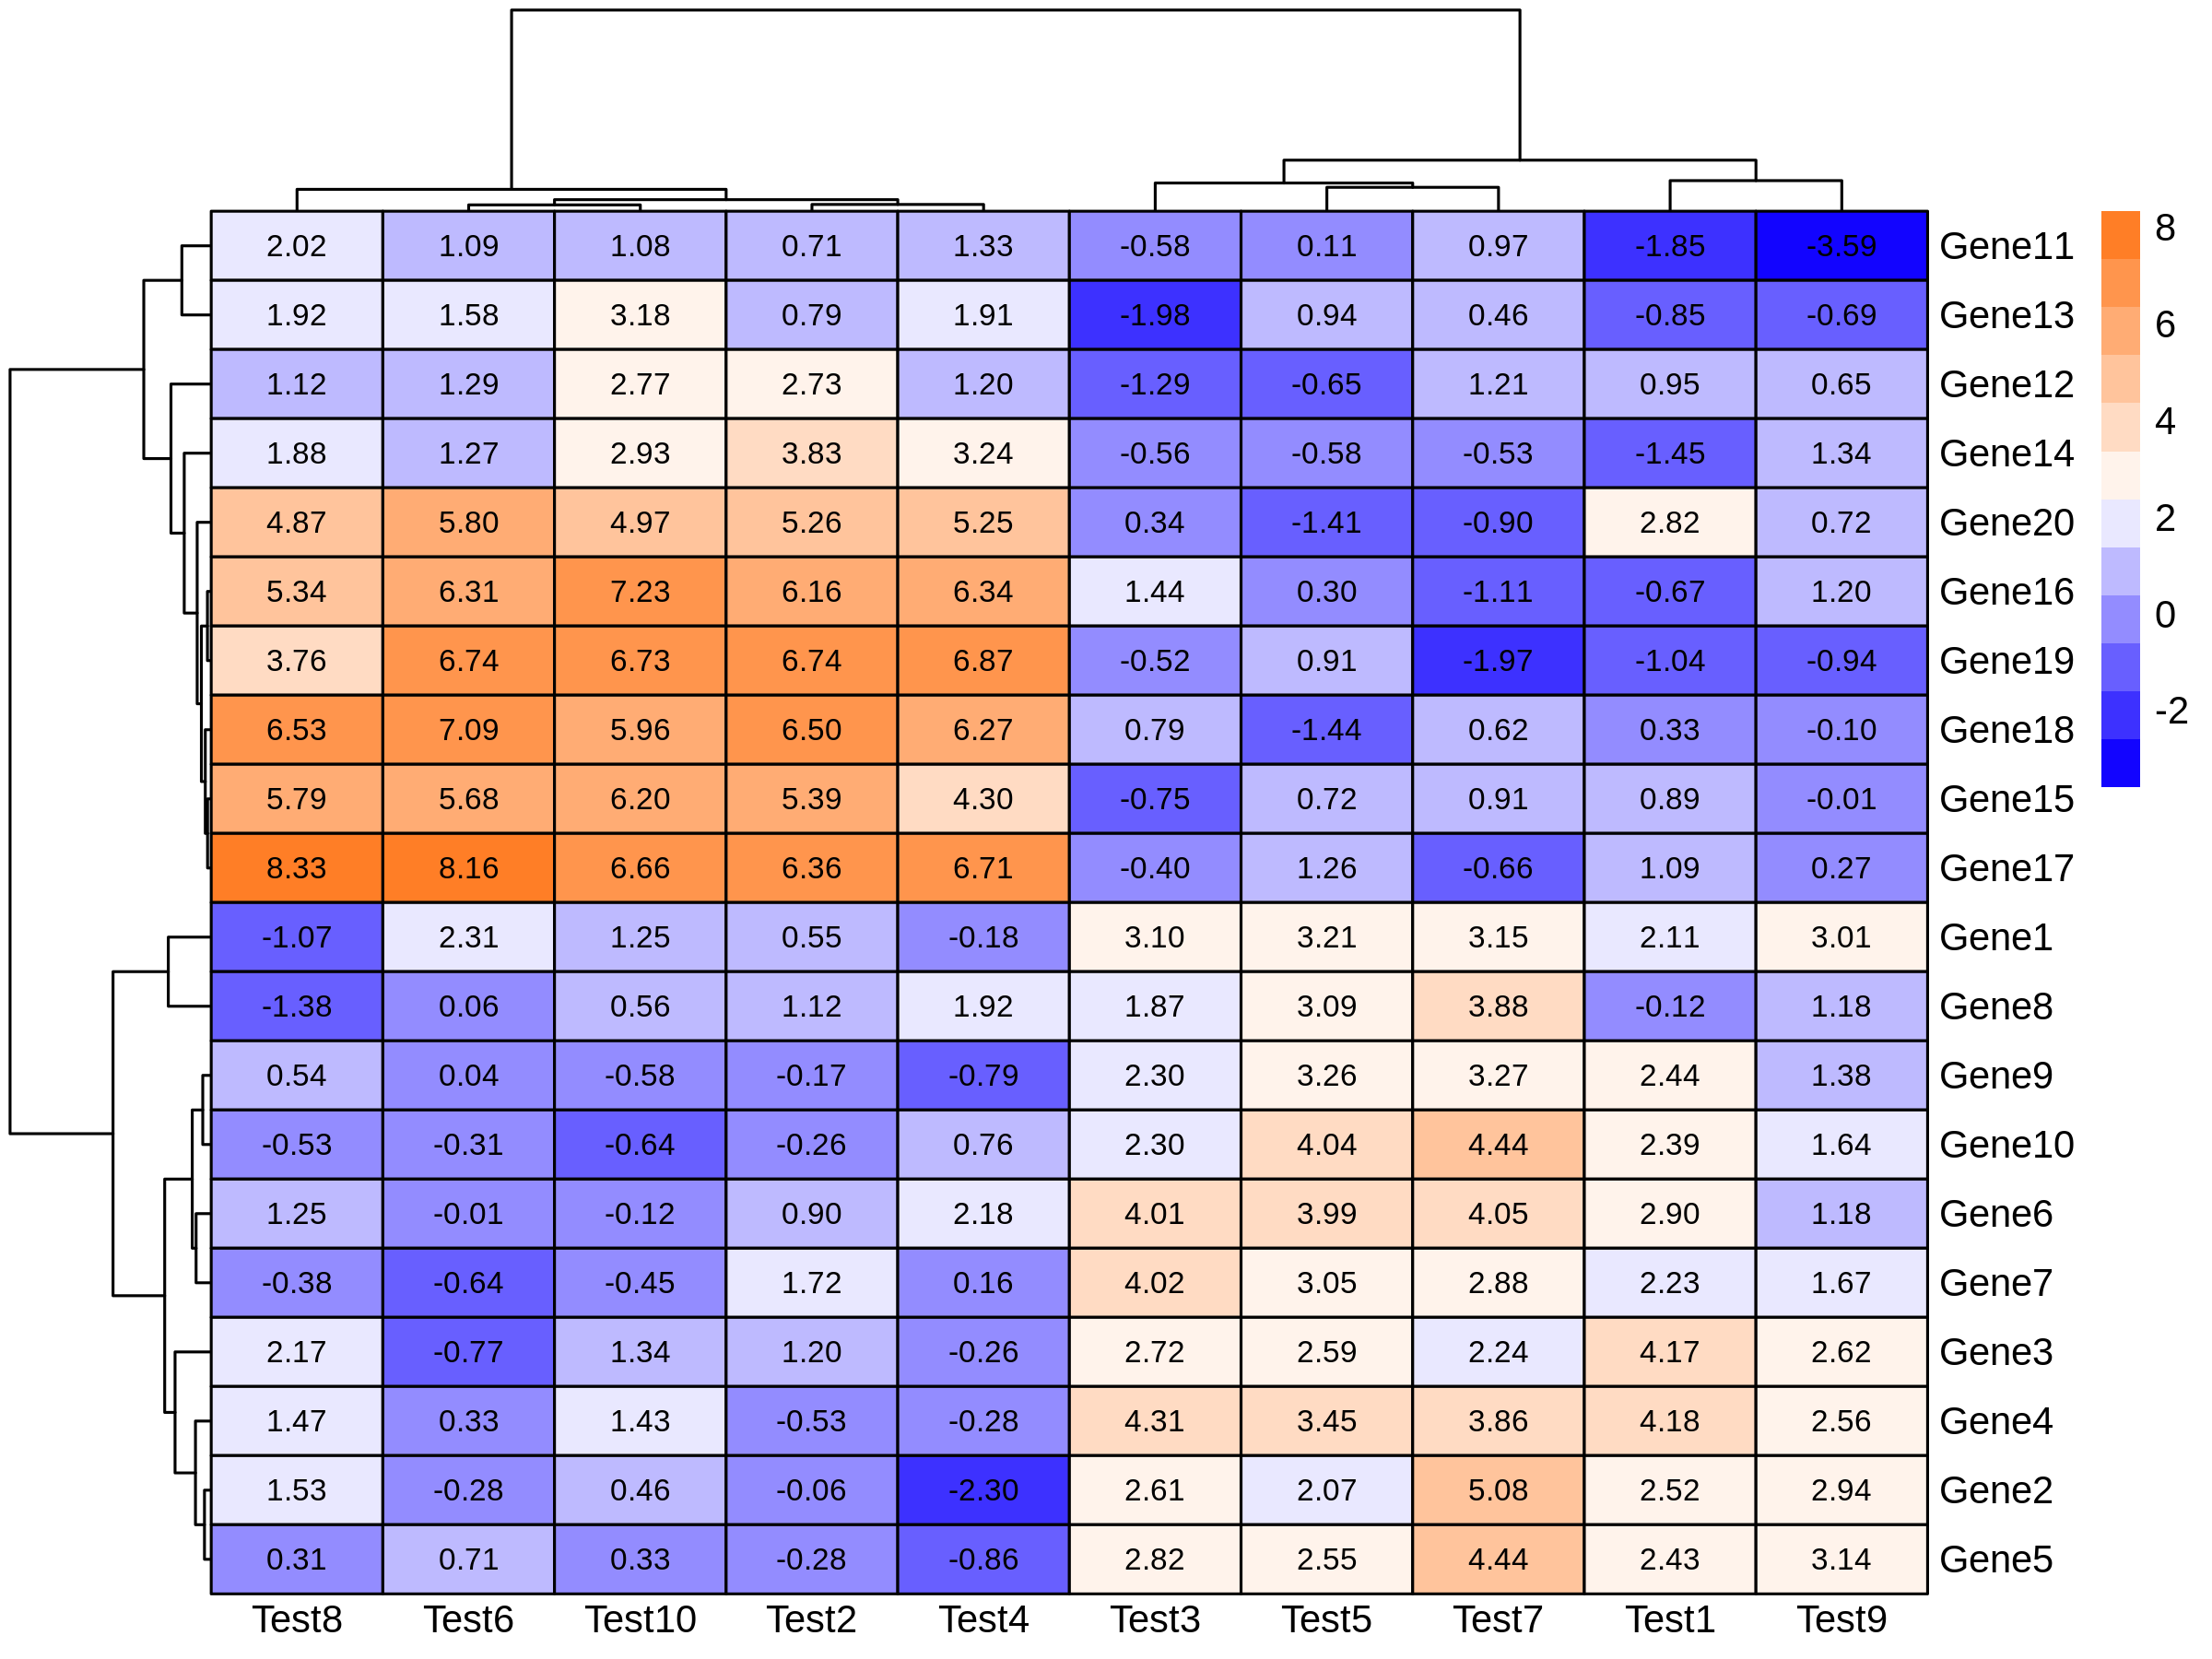
Heatmap
Draw a heatmap for the given dataset
Histogram
Draw a histogram for the given dataset
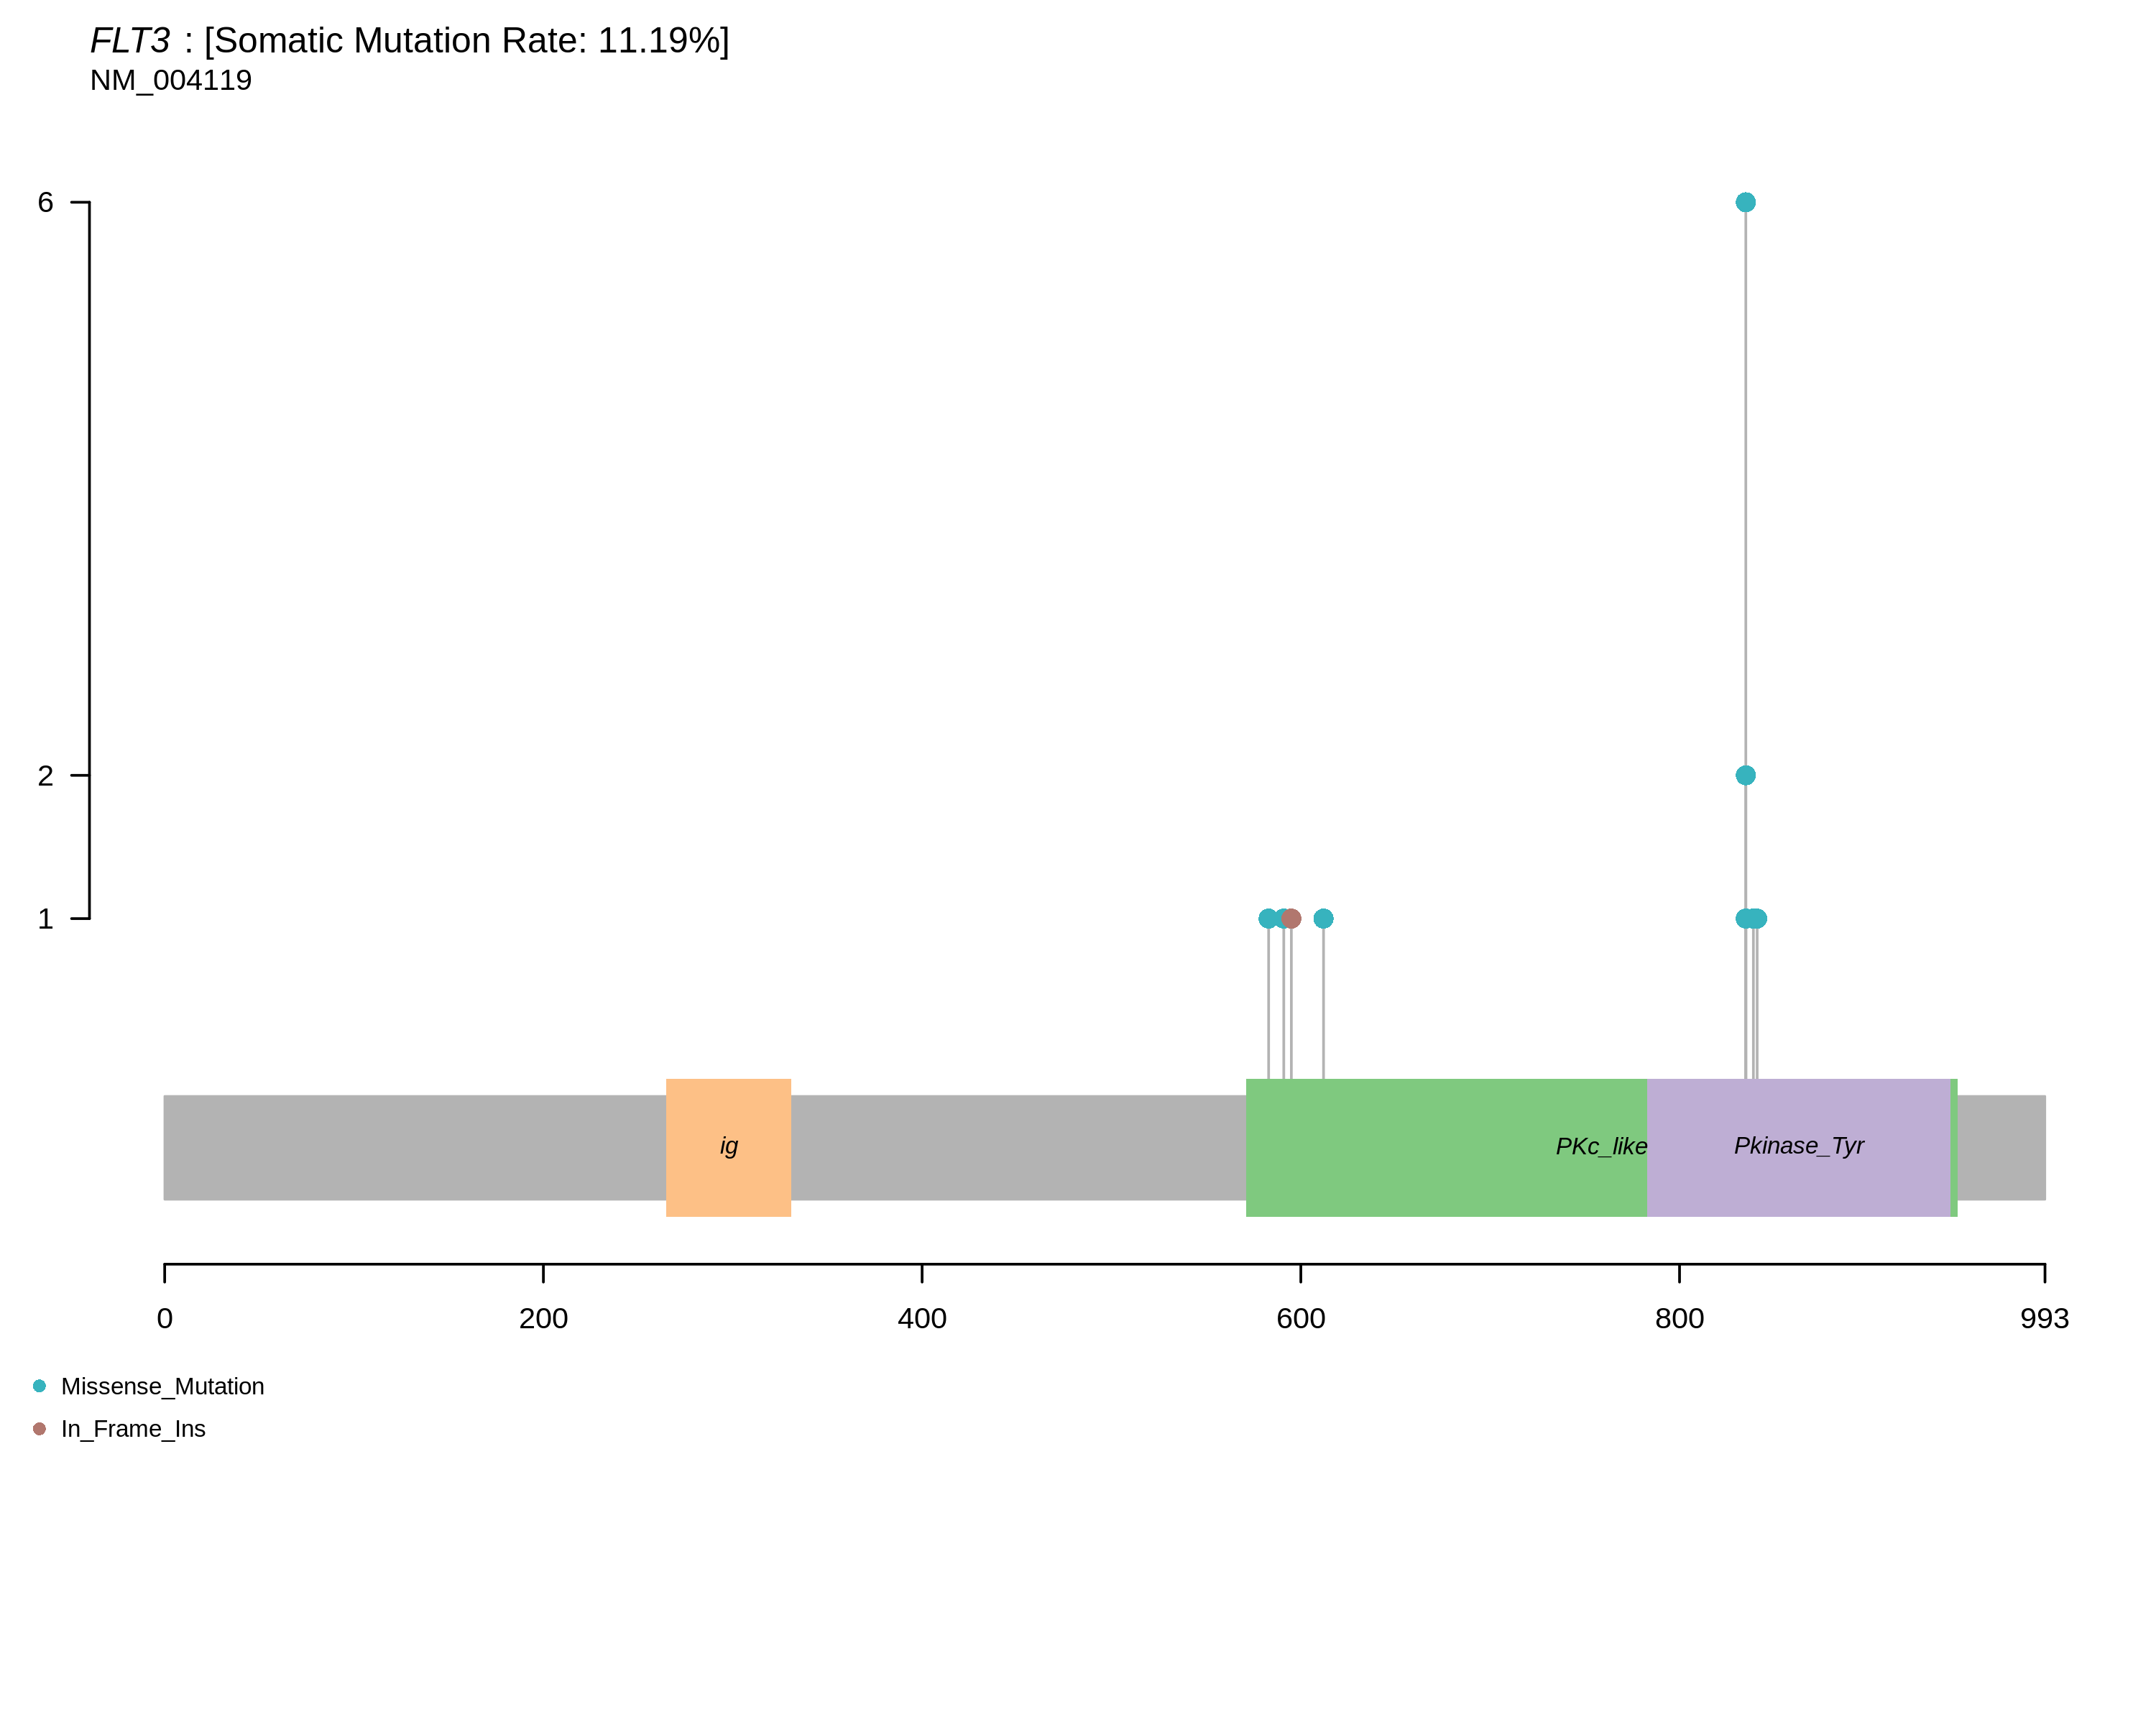
Lollipop
Draw a lollipop for the given dataset
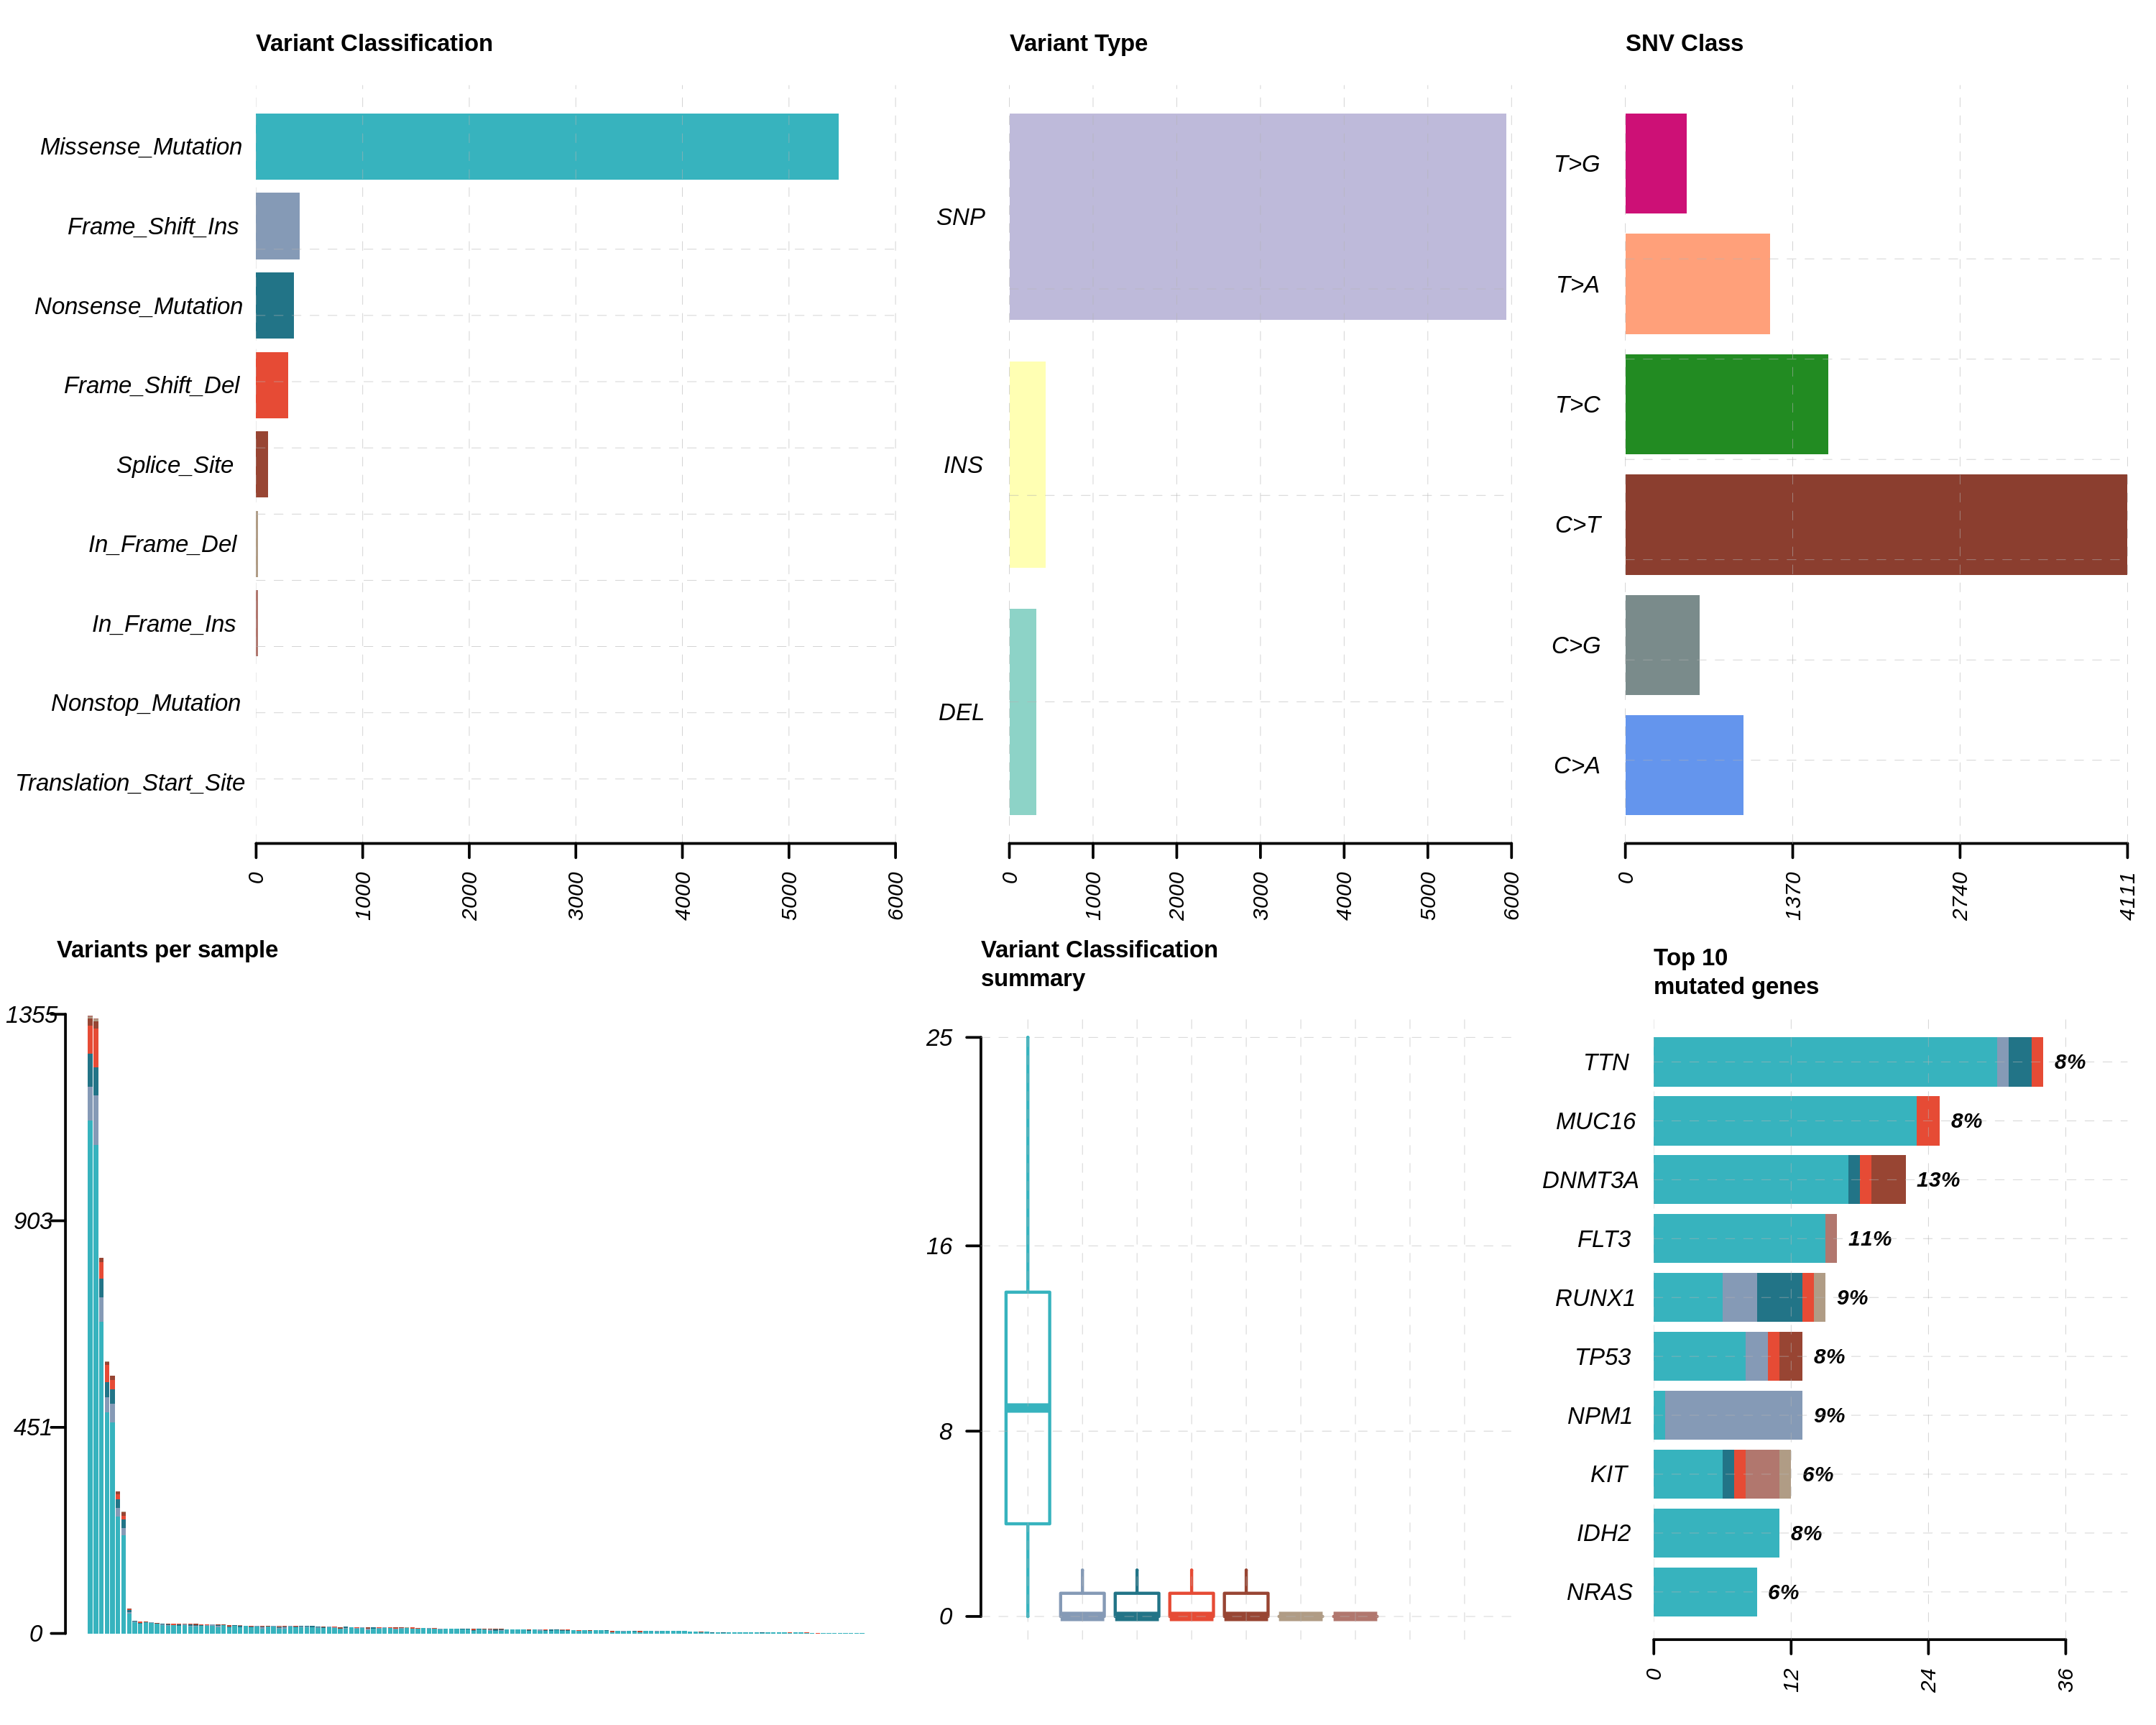
Mafsummary
Draw a MAF summary for the given dataset
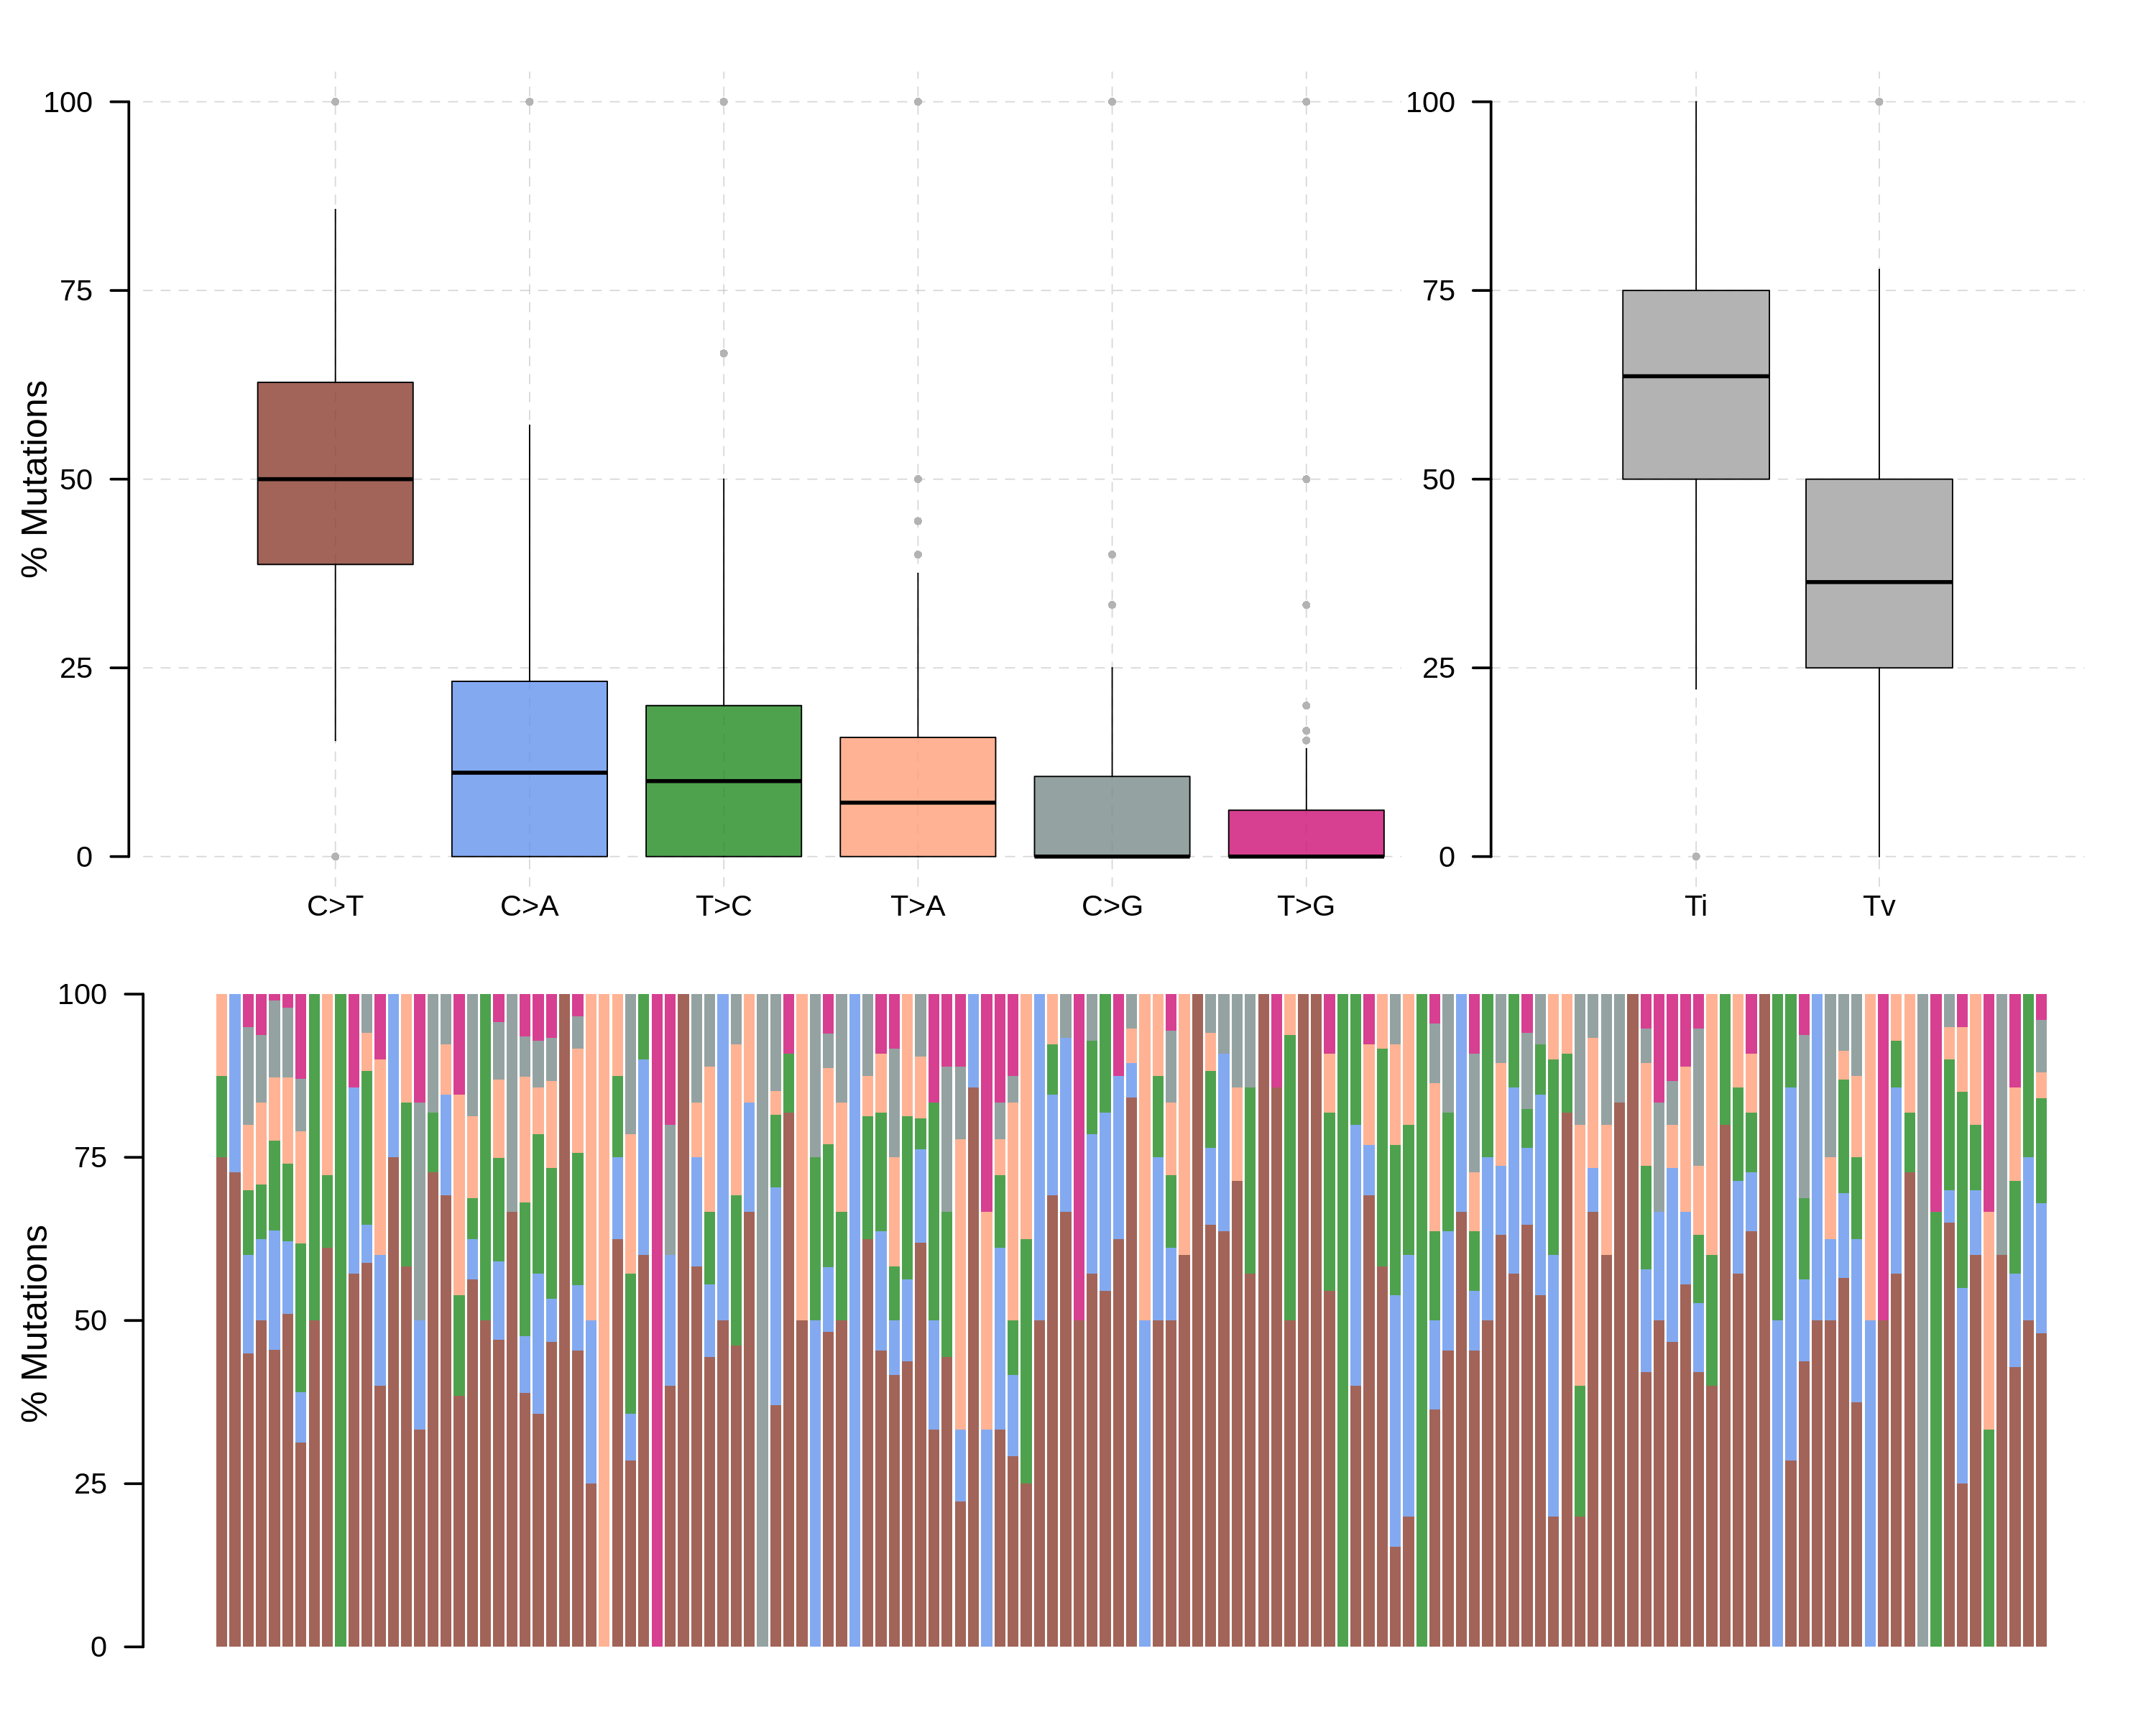
Maftitv
Draw a MAF titv for the given dataset
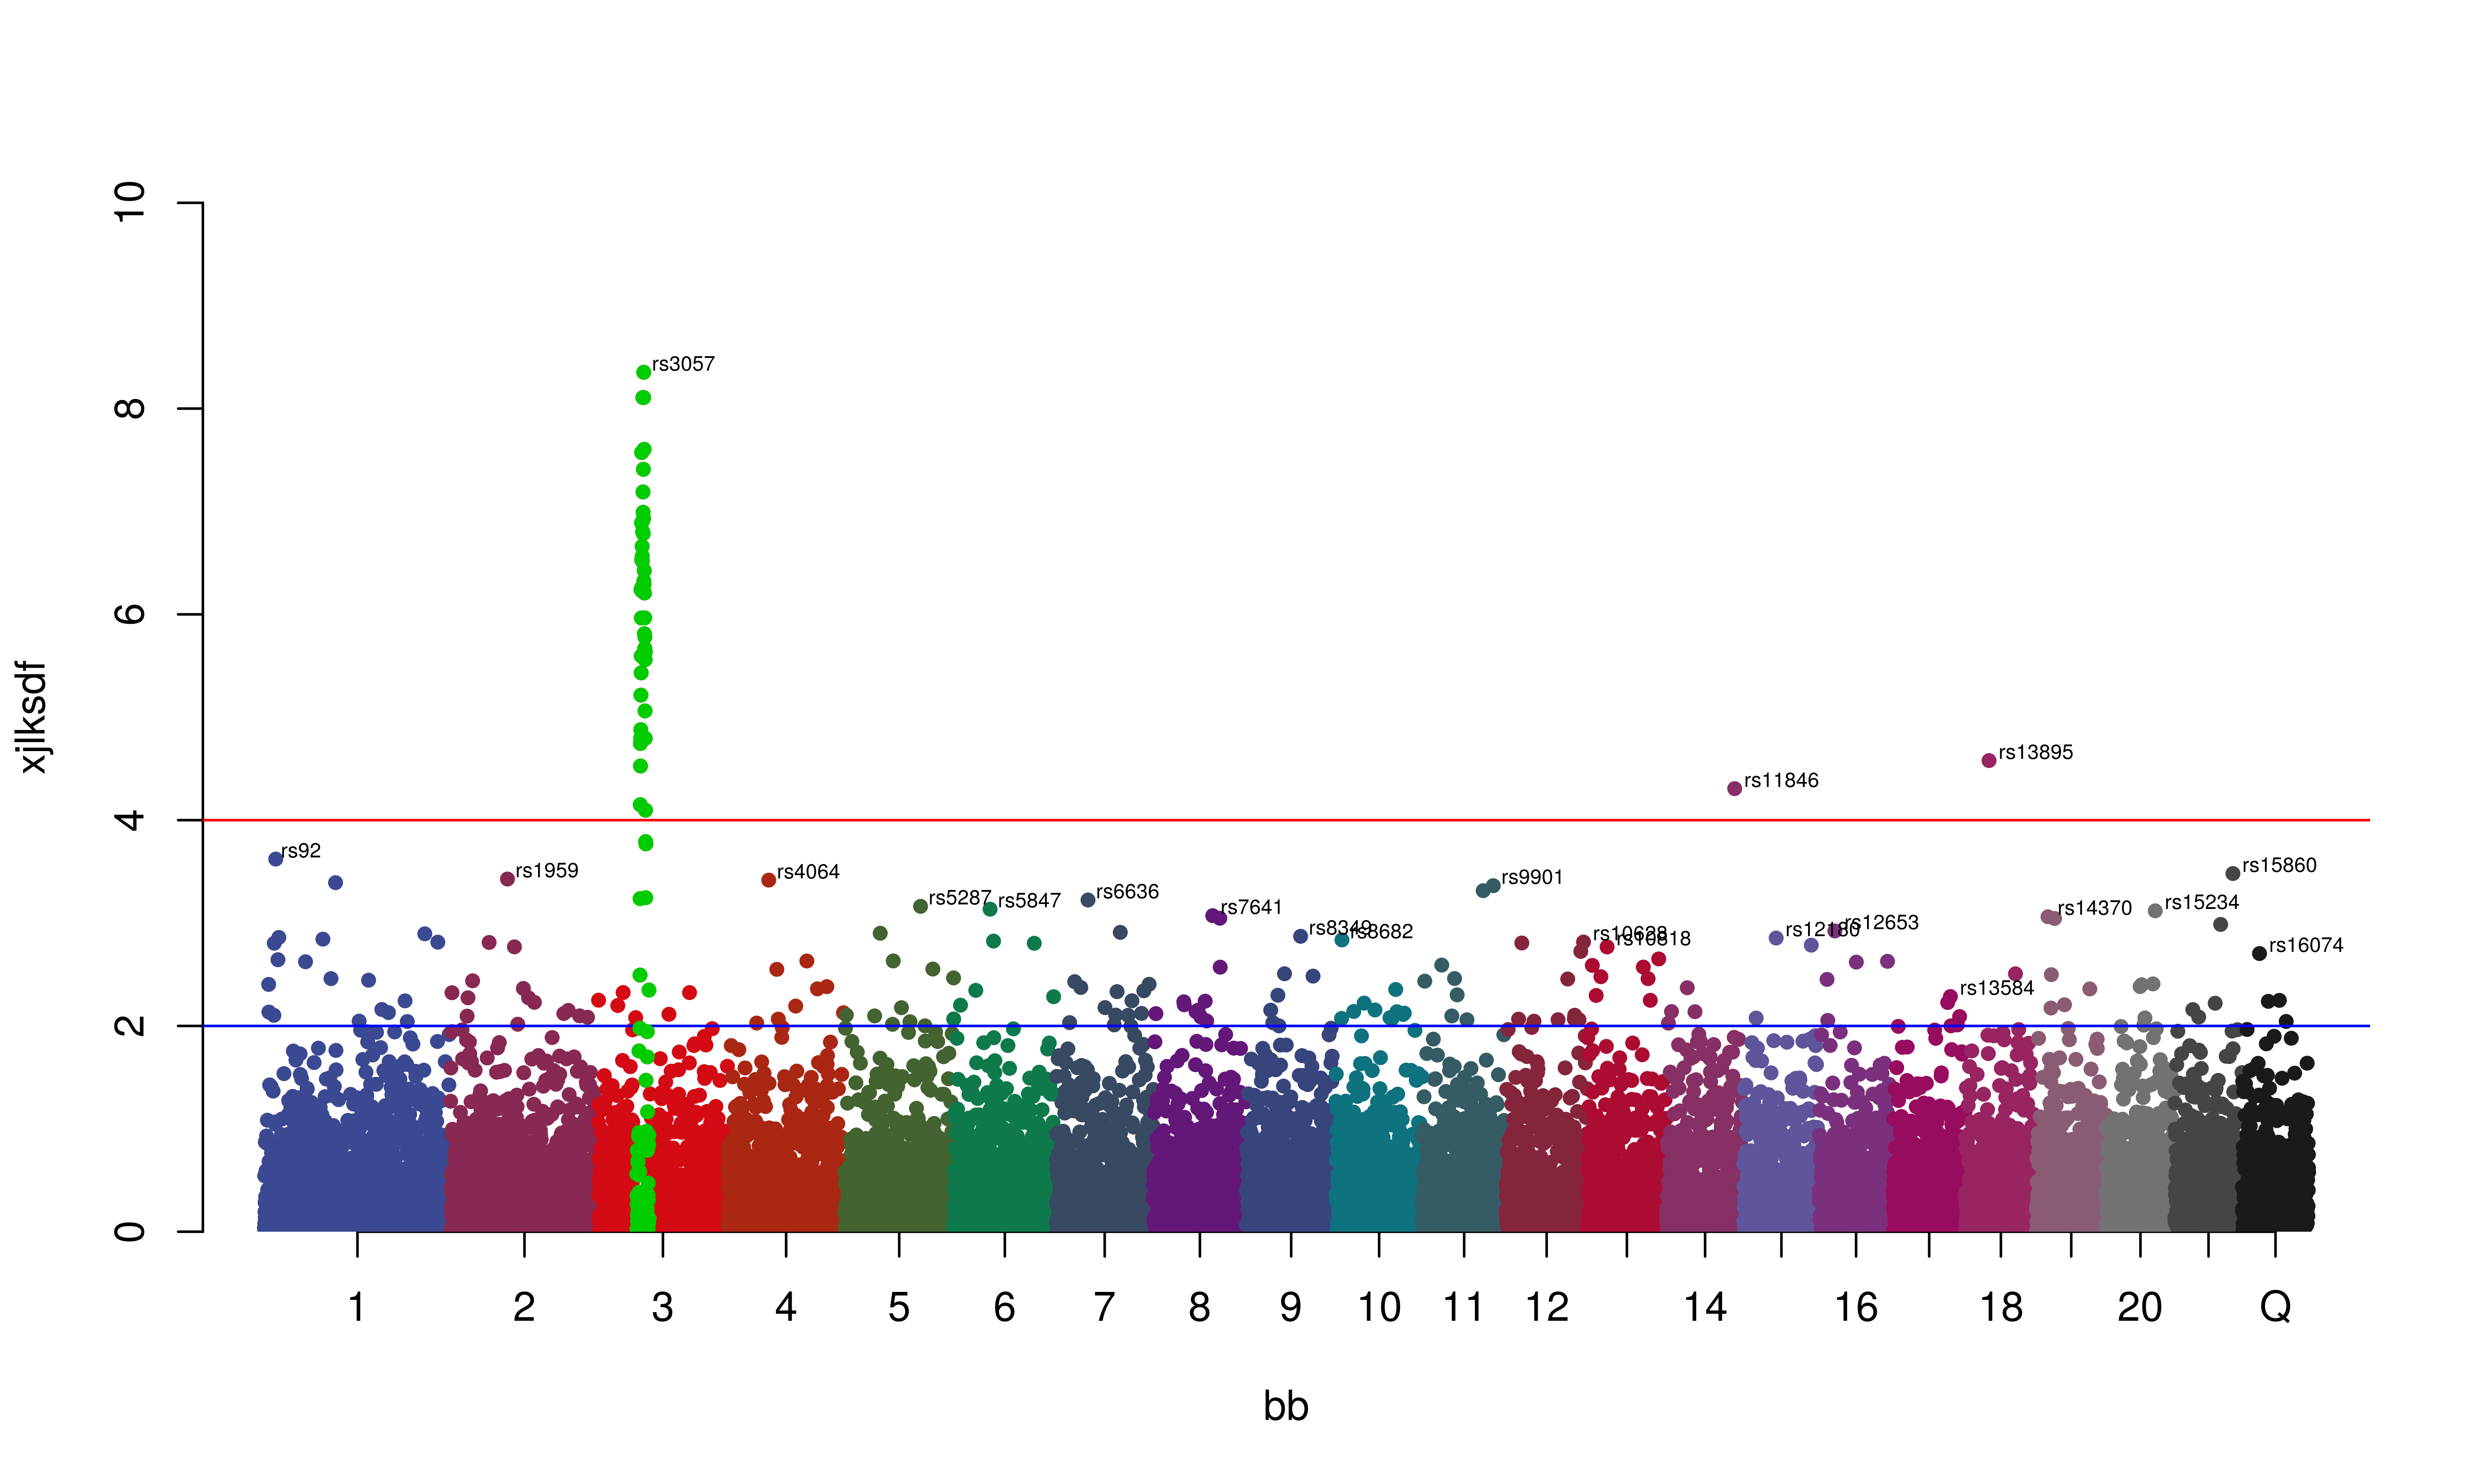
Manhattan
This program produces a manhattan plot given a snp file and other settings.
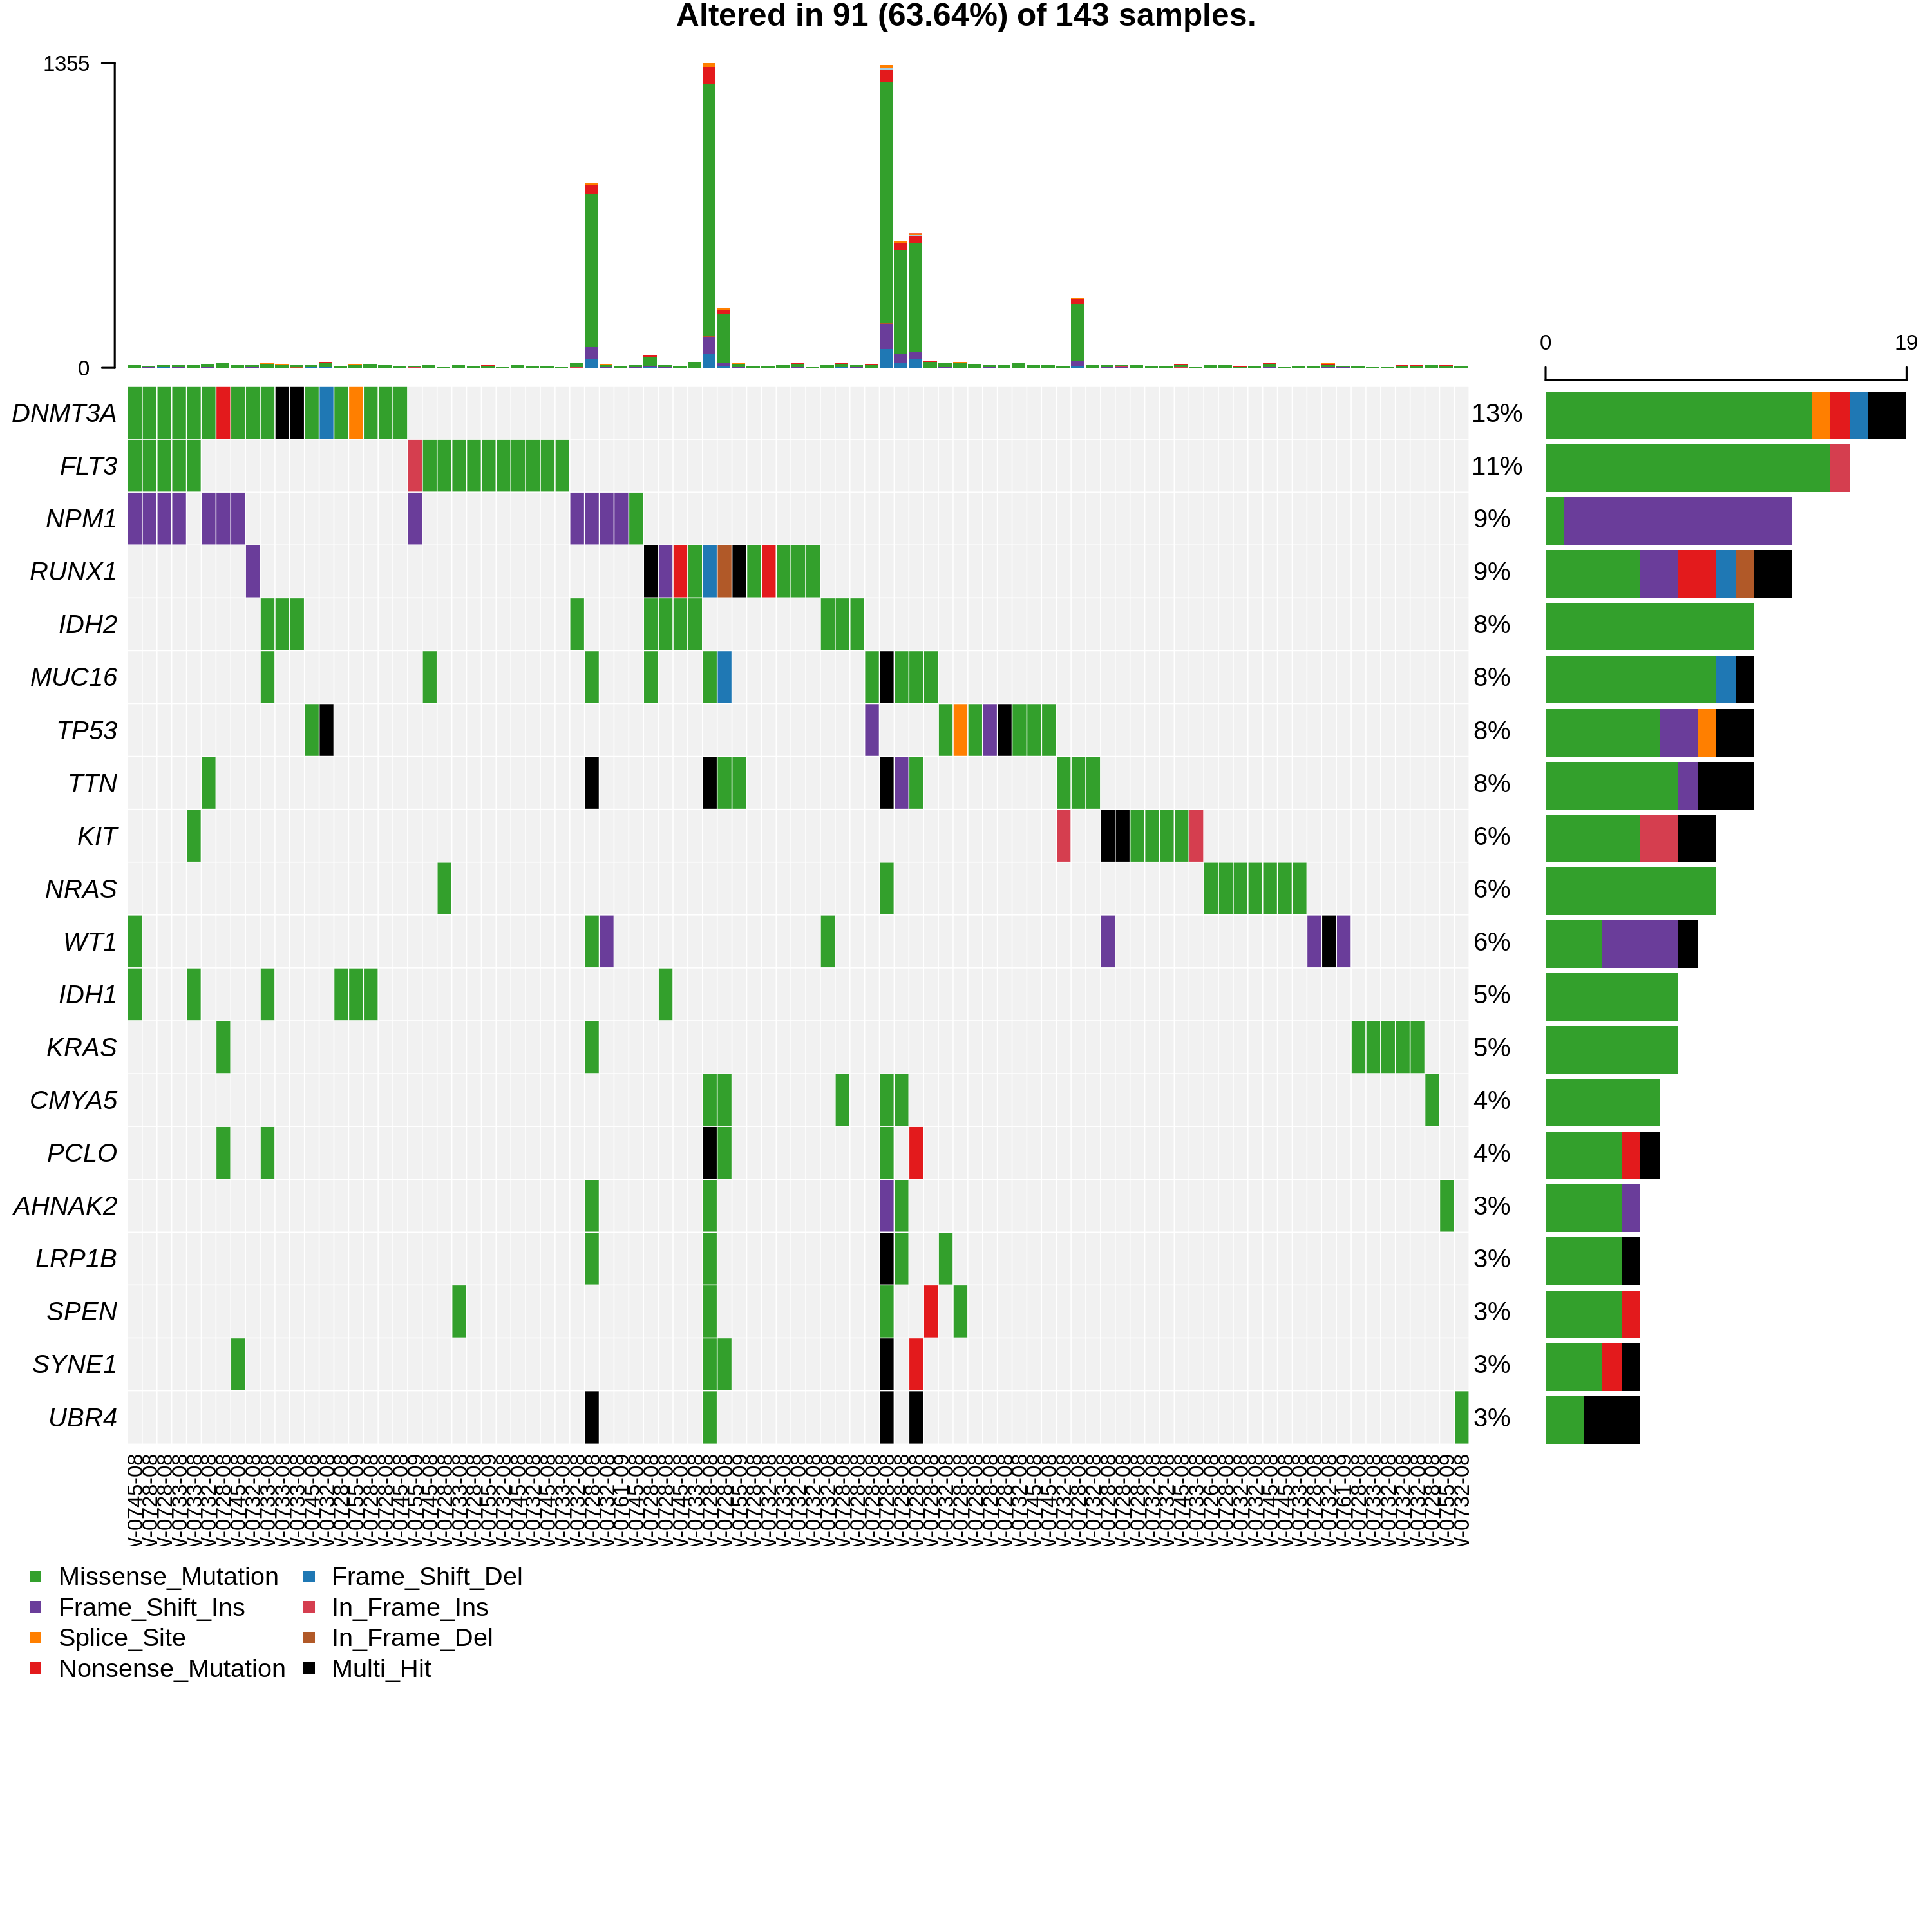
Oncoprint
Draw a oncoprint for the given dataset
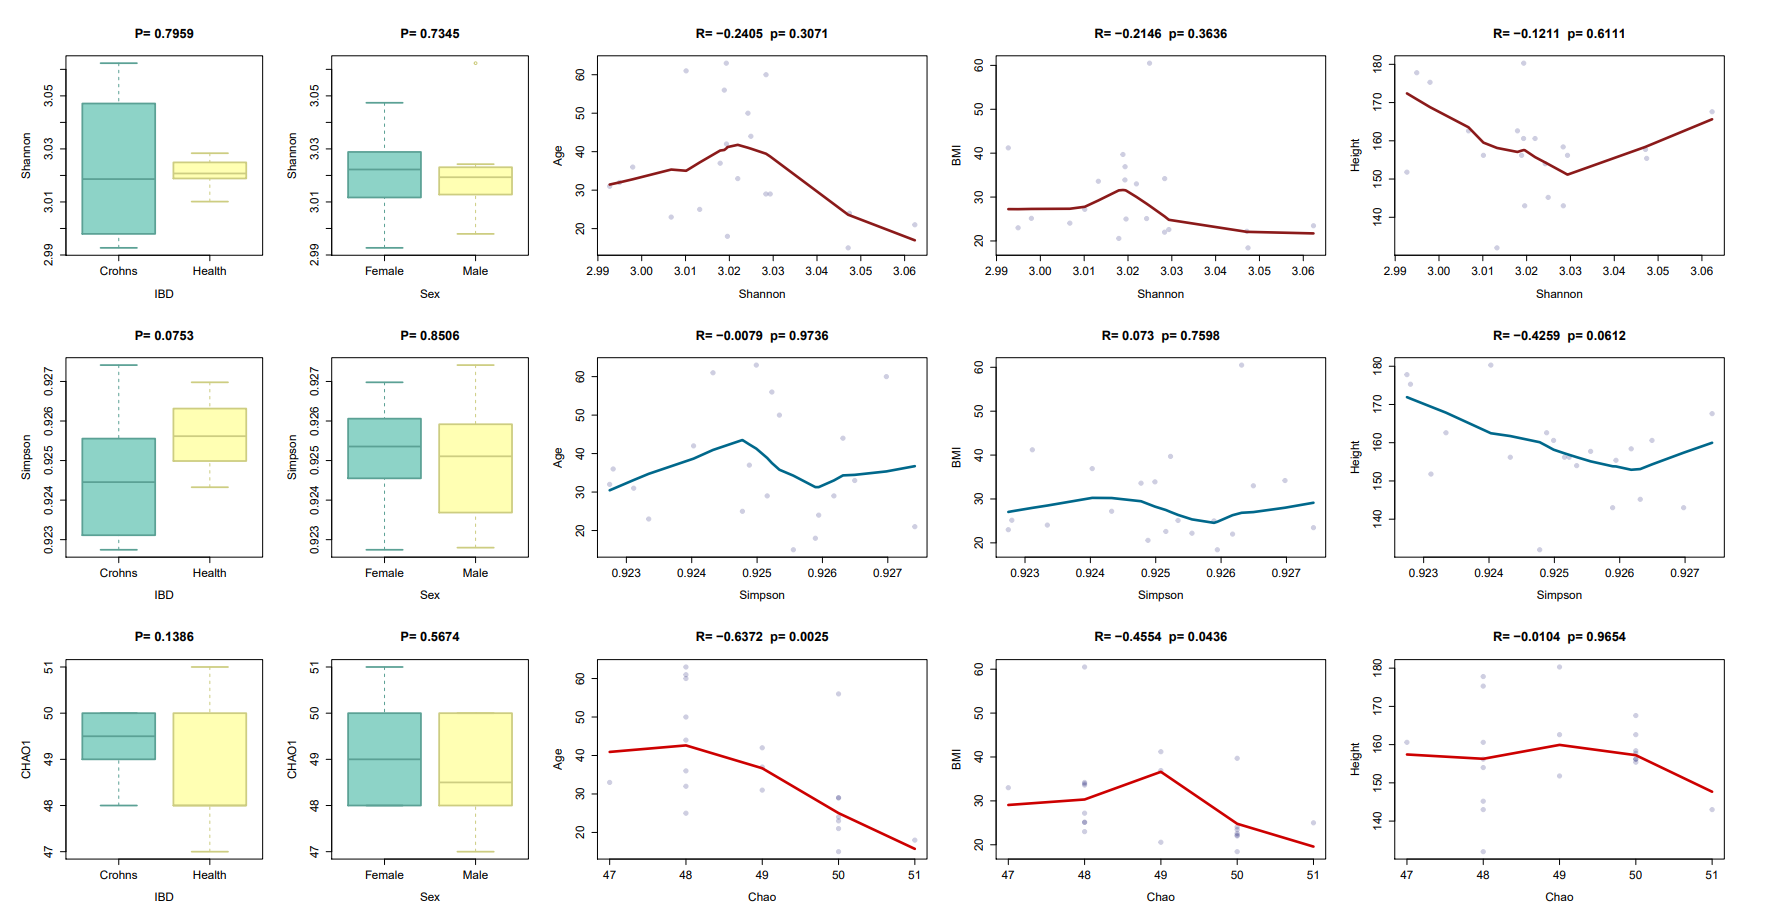
PM-Adiversity
Alpha diversity index calculation and plotting

PM-comp-cor
Computing feature correlation coefficients and constructing co-occurrence networks.

PM-comp-func
Computing functional distances between samples and visualizing through heatmaps and cluster analysis.

PM-comp-taxa
Computing Meta-Storms distances between samples and visualizing through heatmaps and cluster analysis.

PM-Distribution
Plot relative abundance bar graph
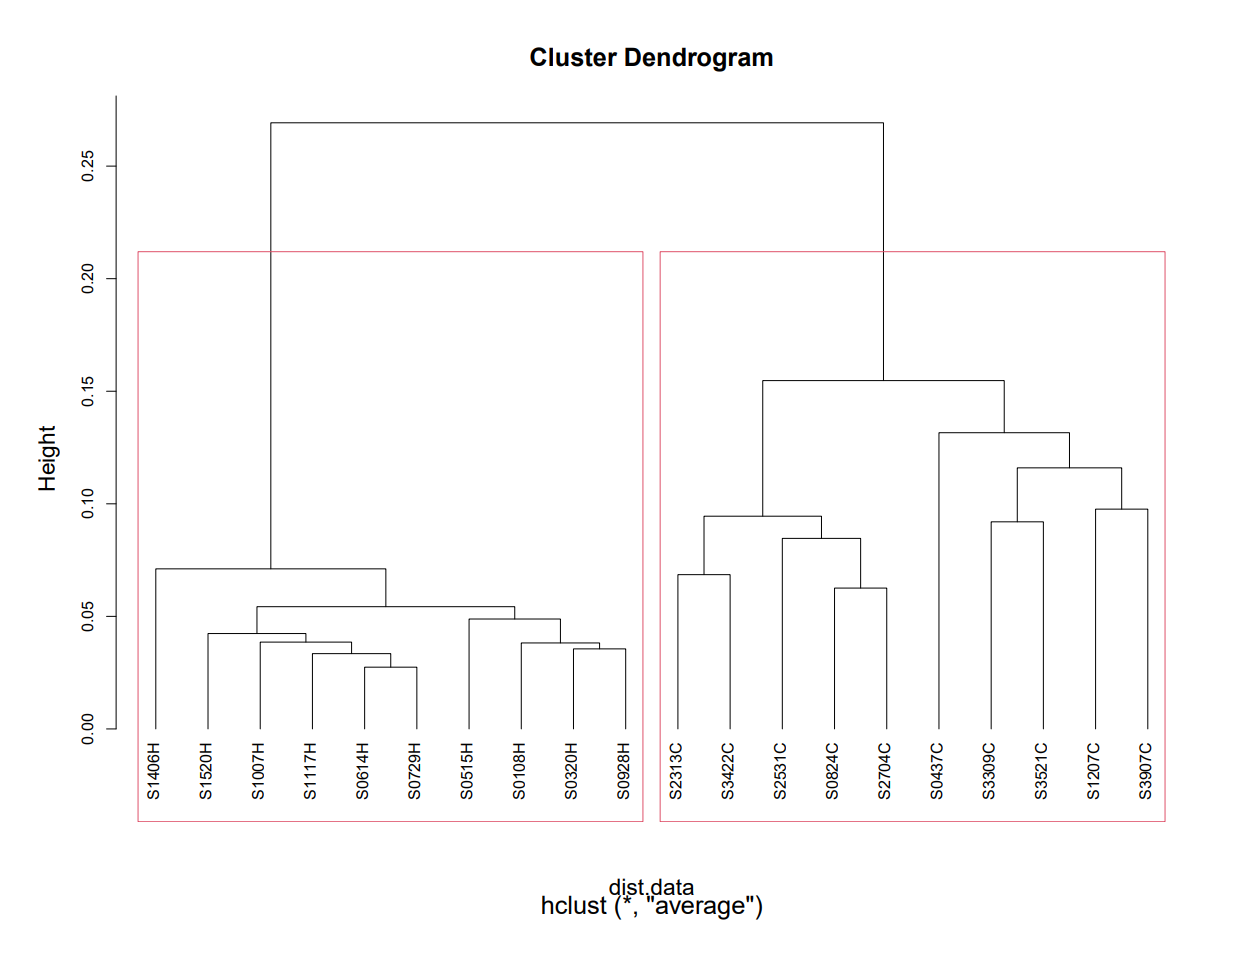
PM-Hcluster
Hierarchical clustering by distance matrix
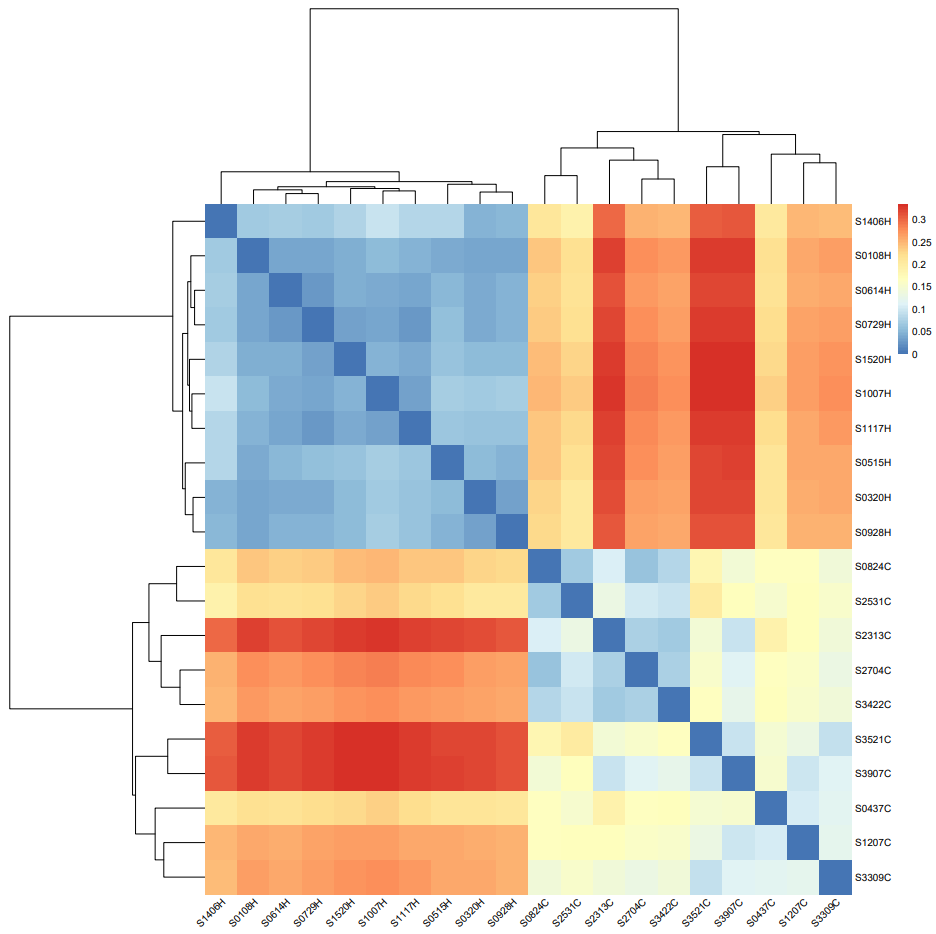
PM-Heatmap
Draw distance matrix heatmap
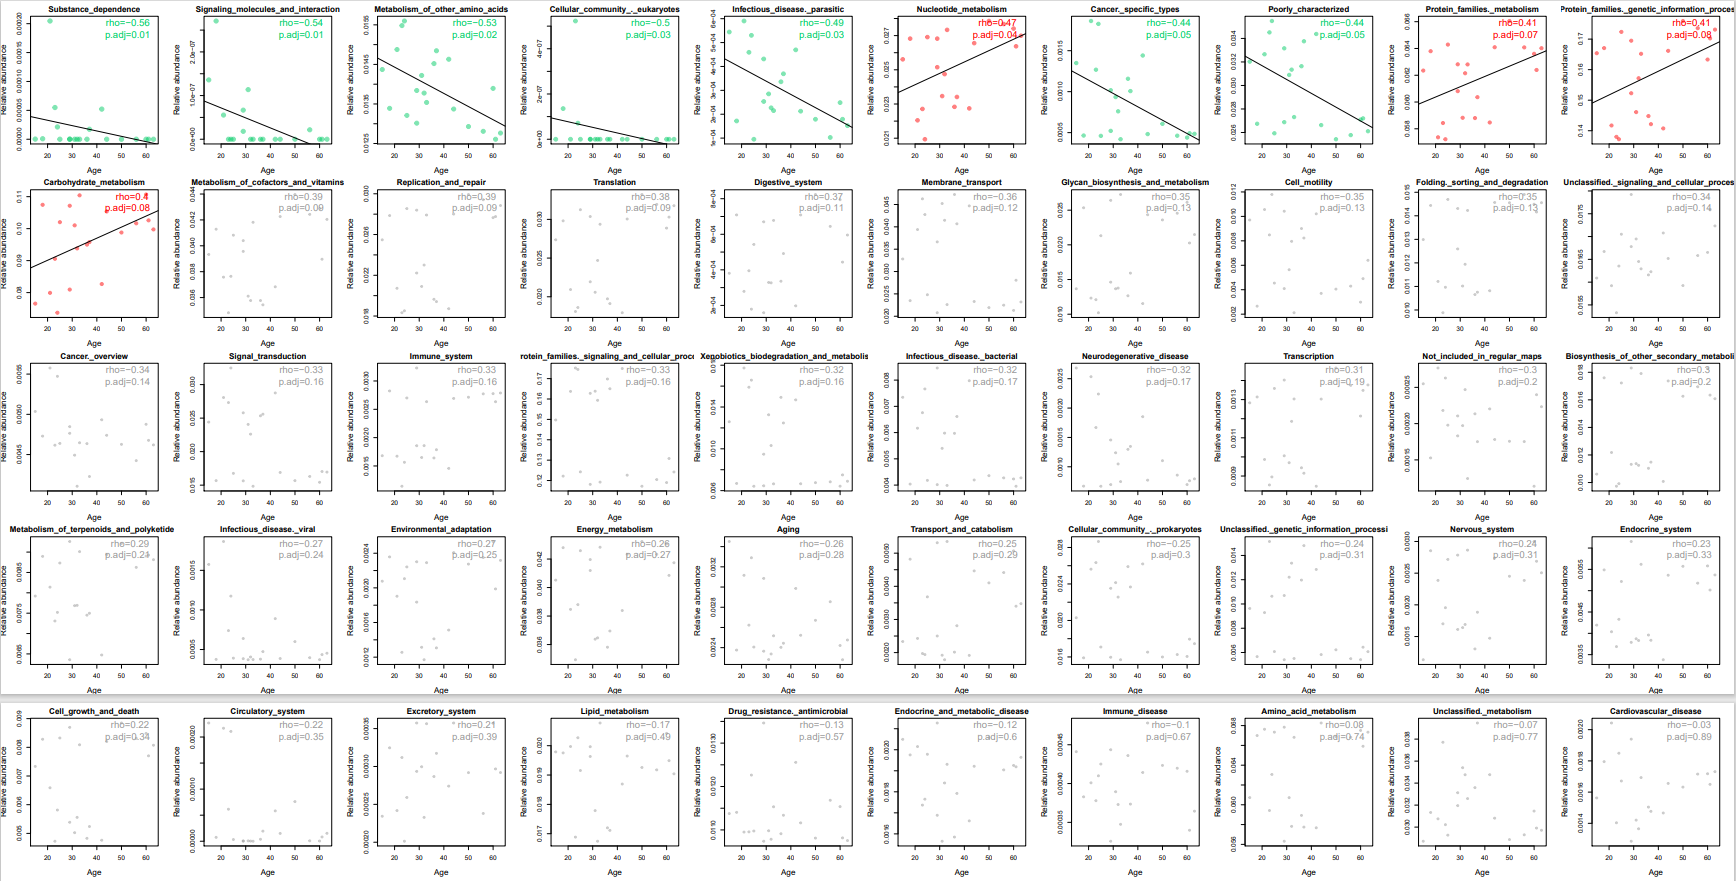
PM-Marker-Corr
Candidate biomarker selection by regression
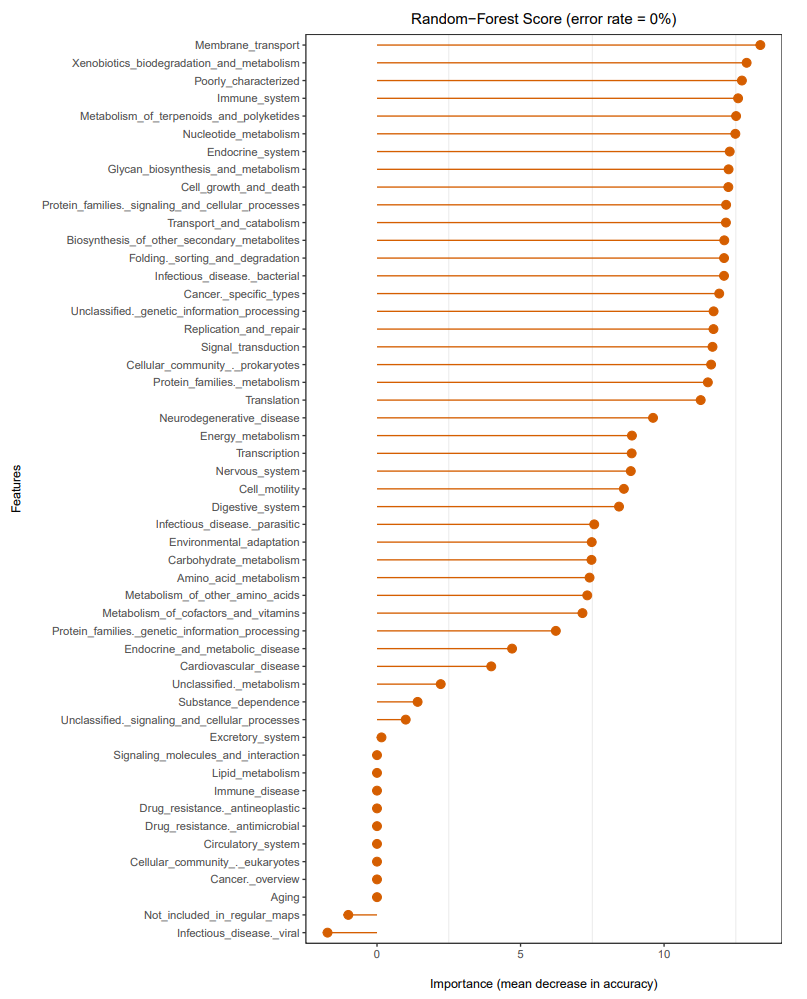
PM-Marker-RFscore
Ranking biomarkers by random forest importance scoring
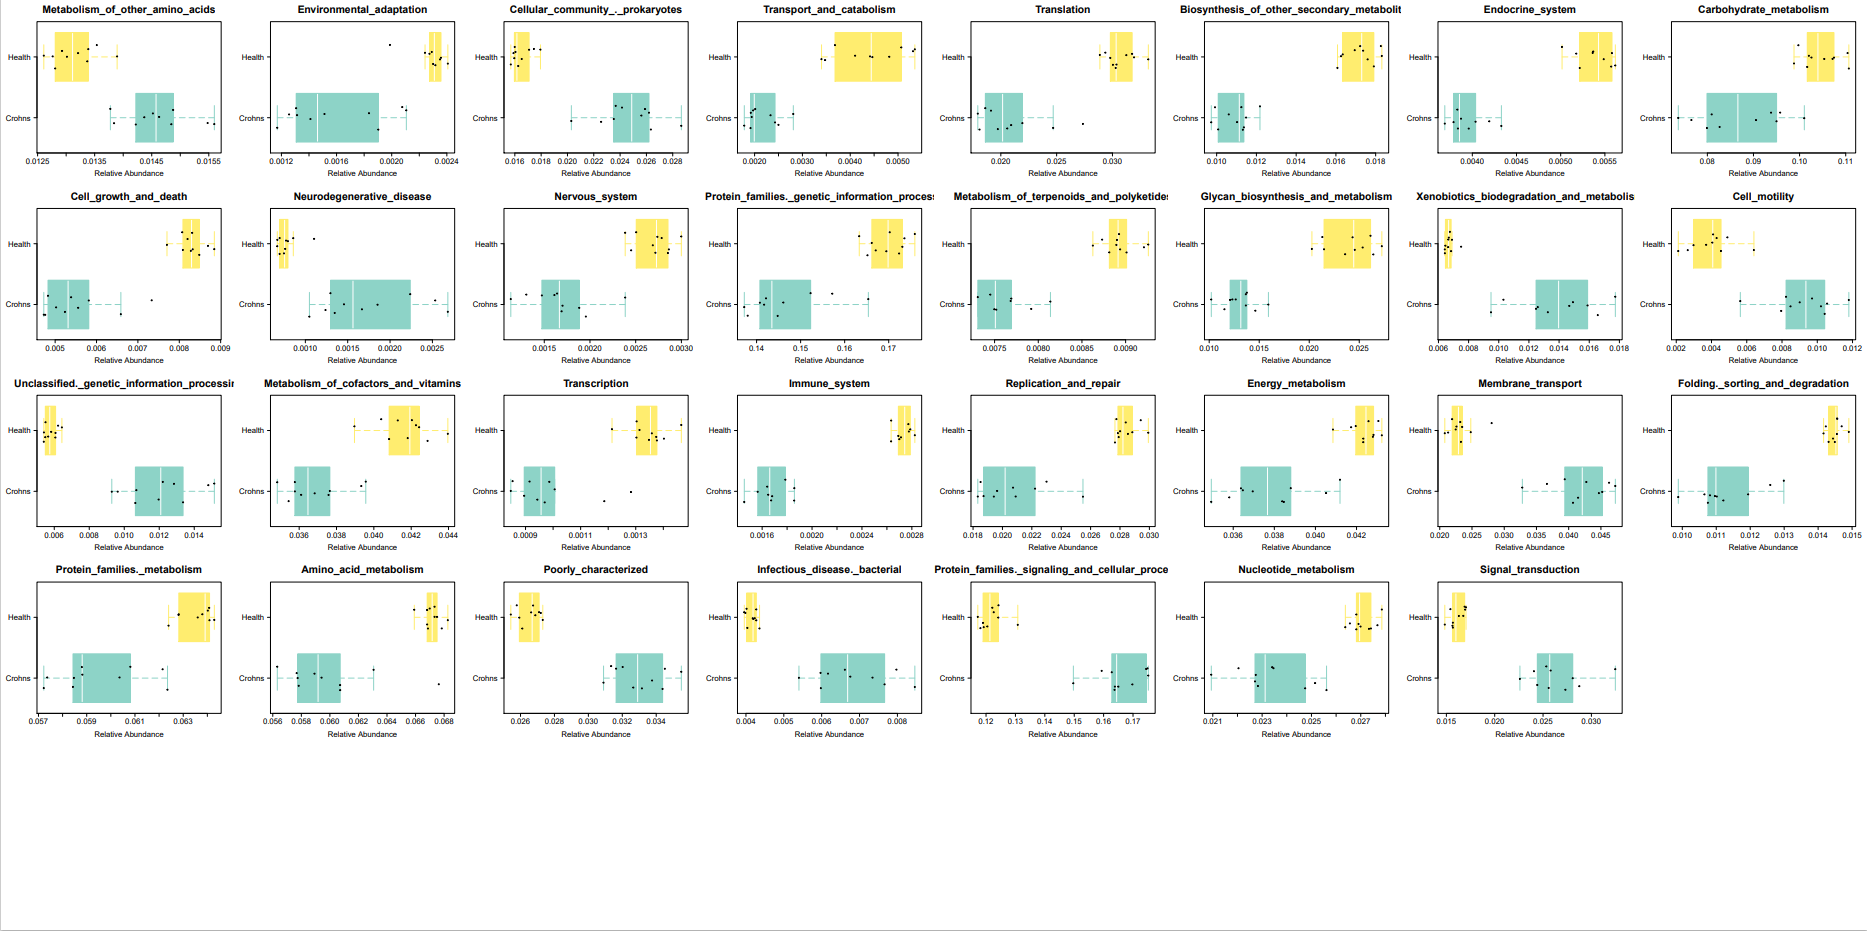
PM-Marker-Test
Candidate biomarker selection by rank sum test
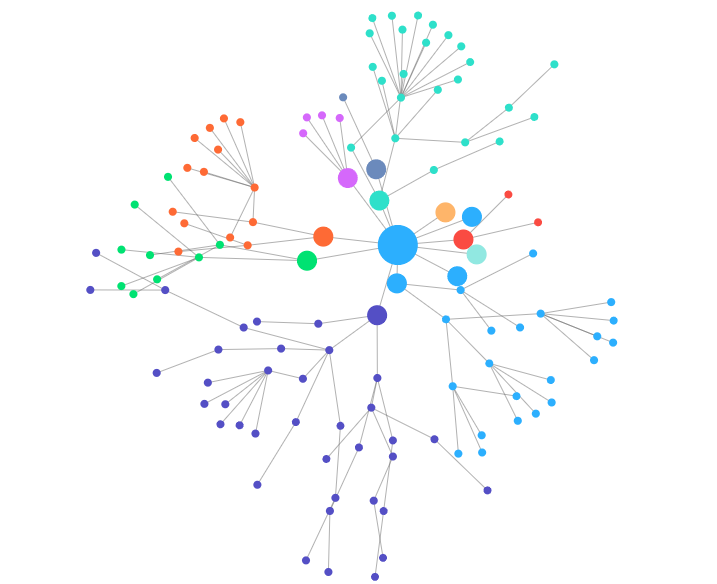
PM-Network
Co-occurrence network mapping using correlations among community members
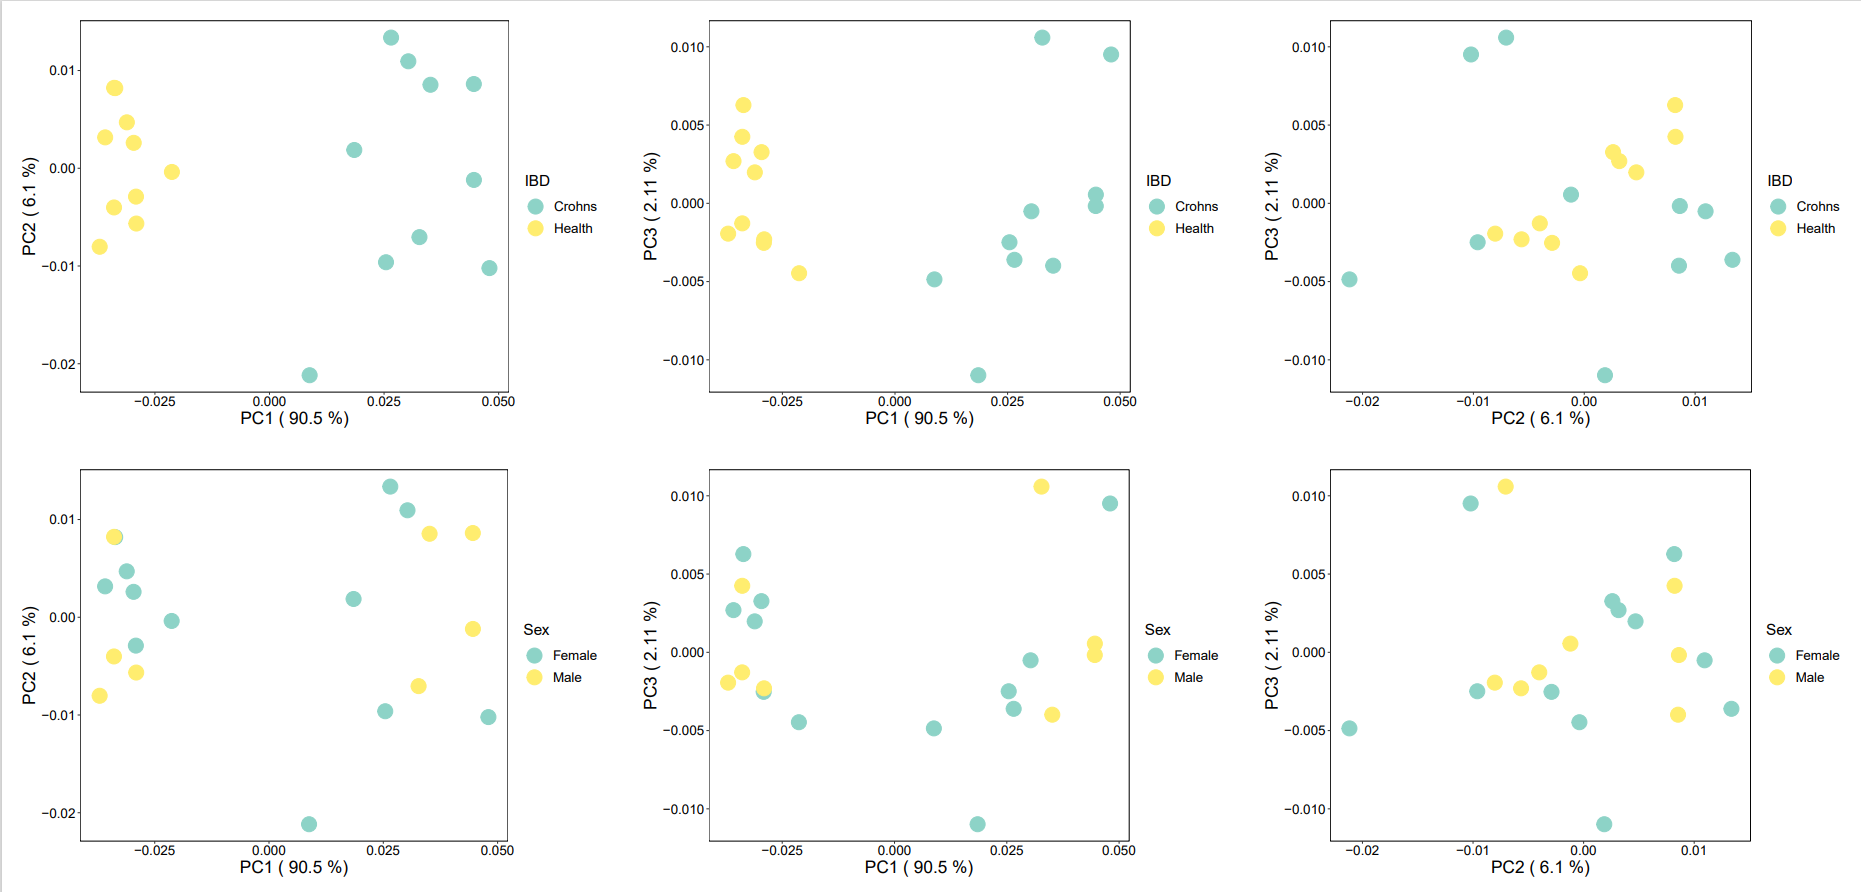
PM-Pca
Perform principal component analysis (PCA) and plot

PM-Pcoa
Perform principal coordinate analysis (PCoA) and plotting
PM-plot-taxa
Visualizing microbial community composition from sequencing data using Krona.

PM-rare-curv
Generates rarefaction curves to show how alpha diversity changes with the number of sequences.
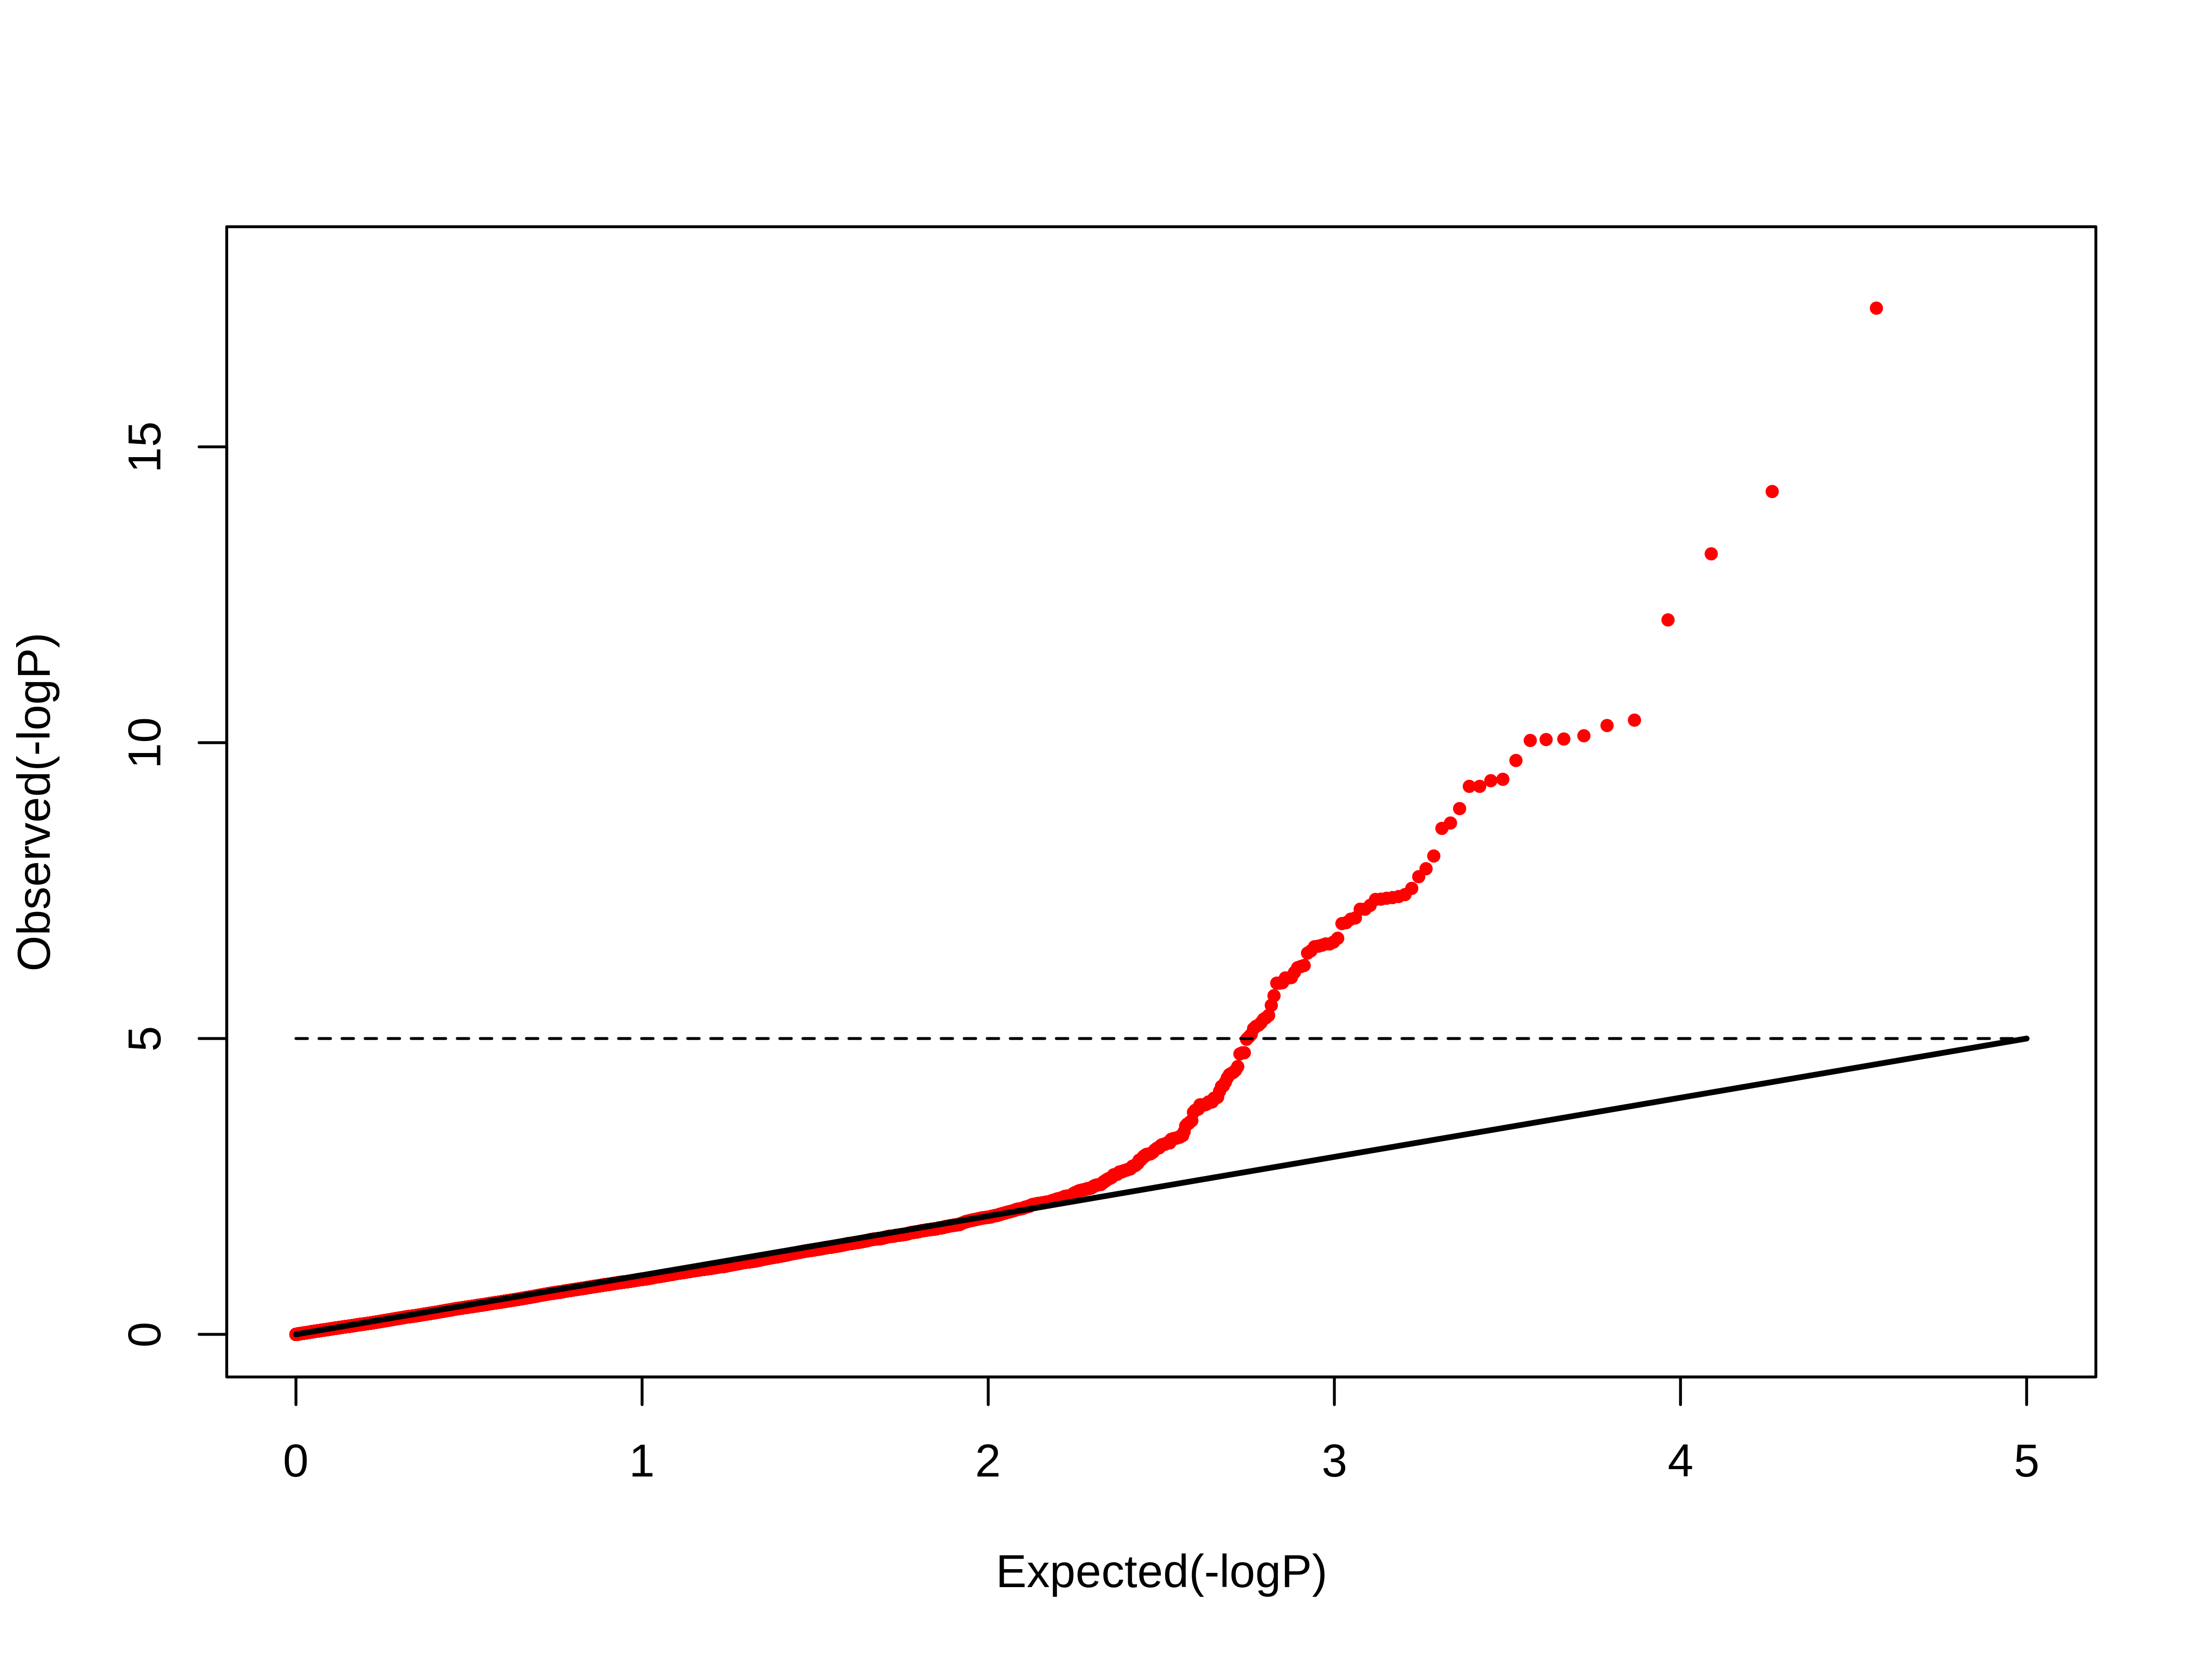
Q-Q
Draw a QQ plot for the given dataset

Survival
Draw a survival plot for the given dataset
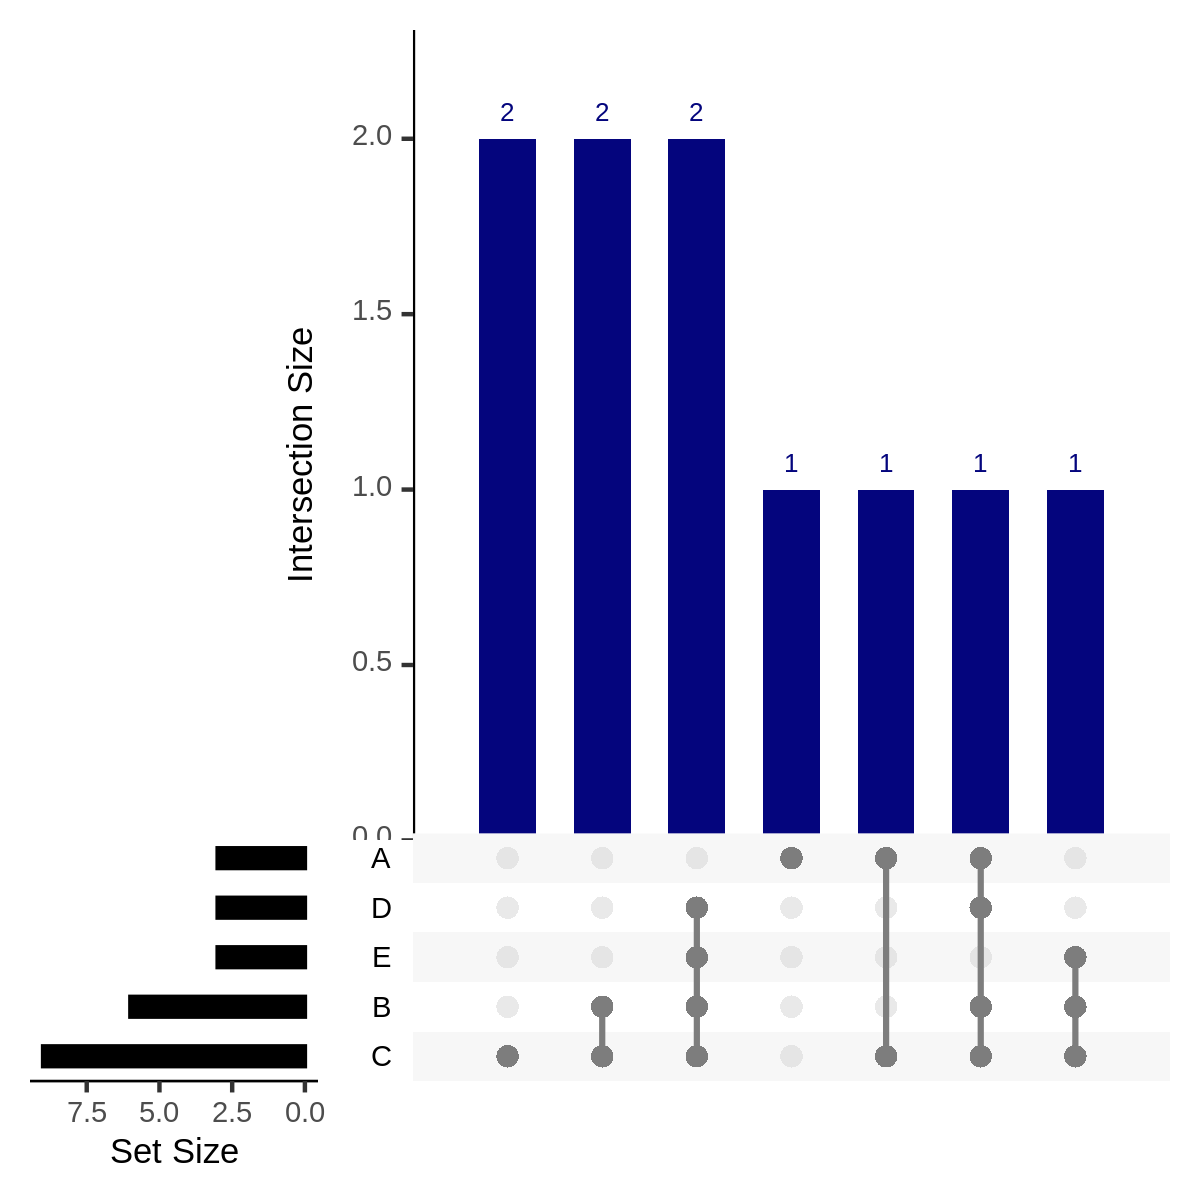
Upset
Draw an upset for the given dataset
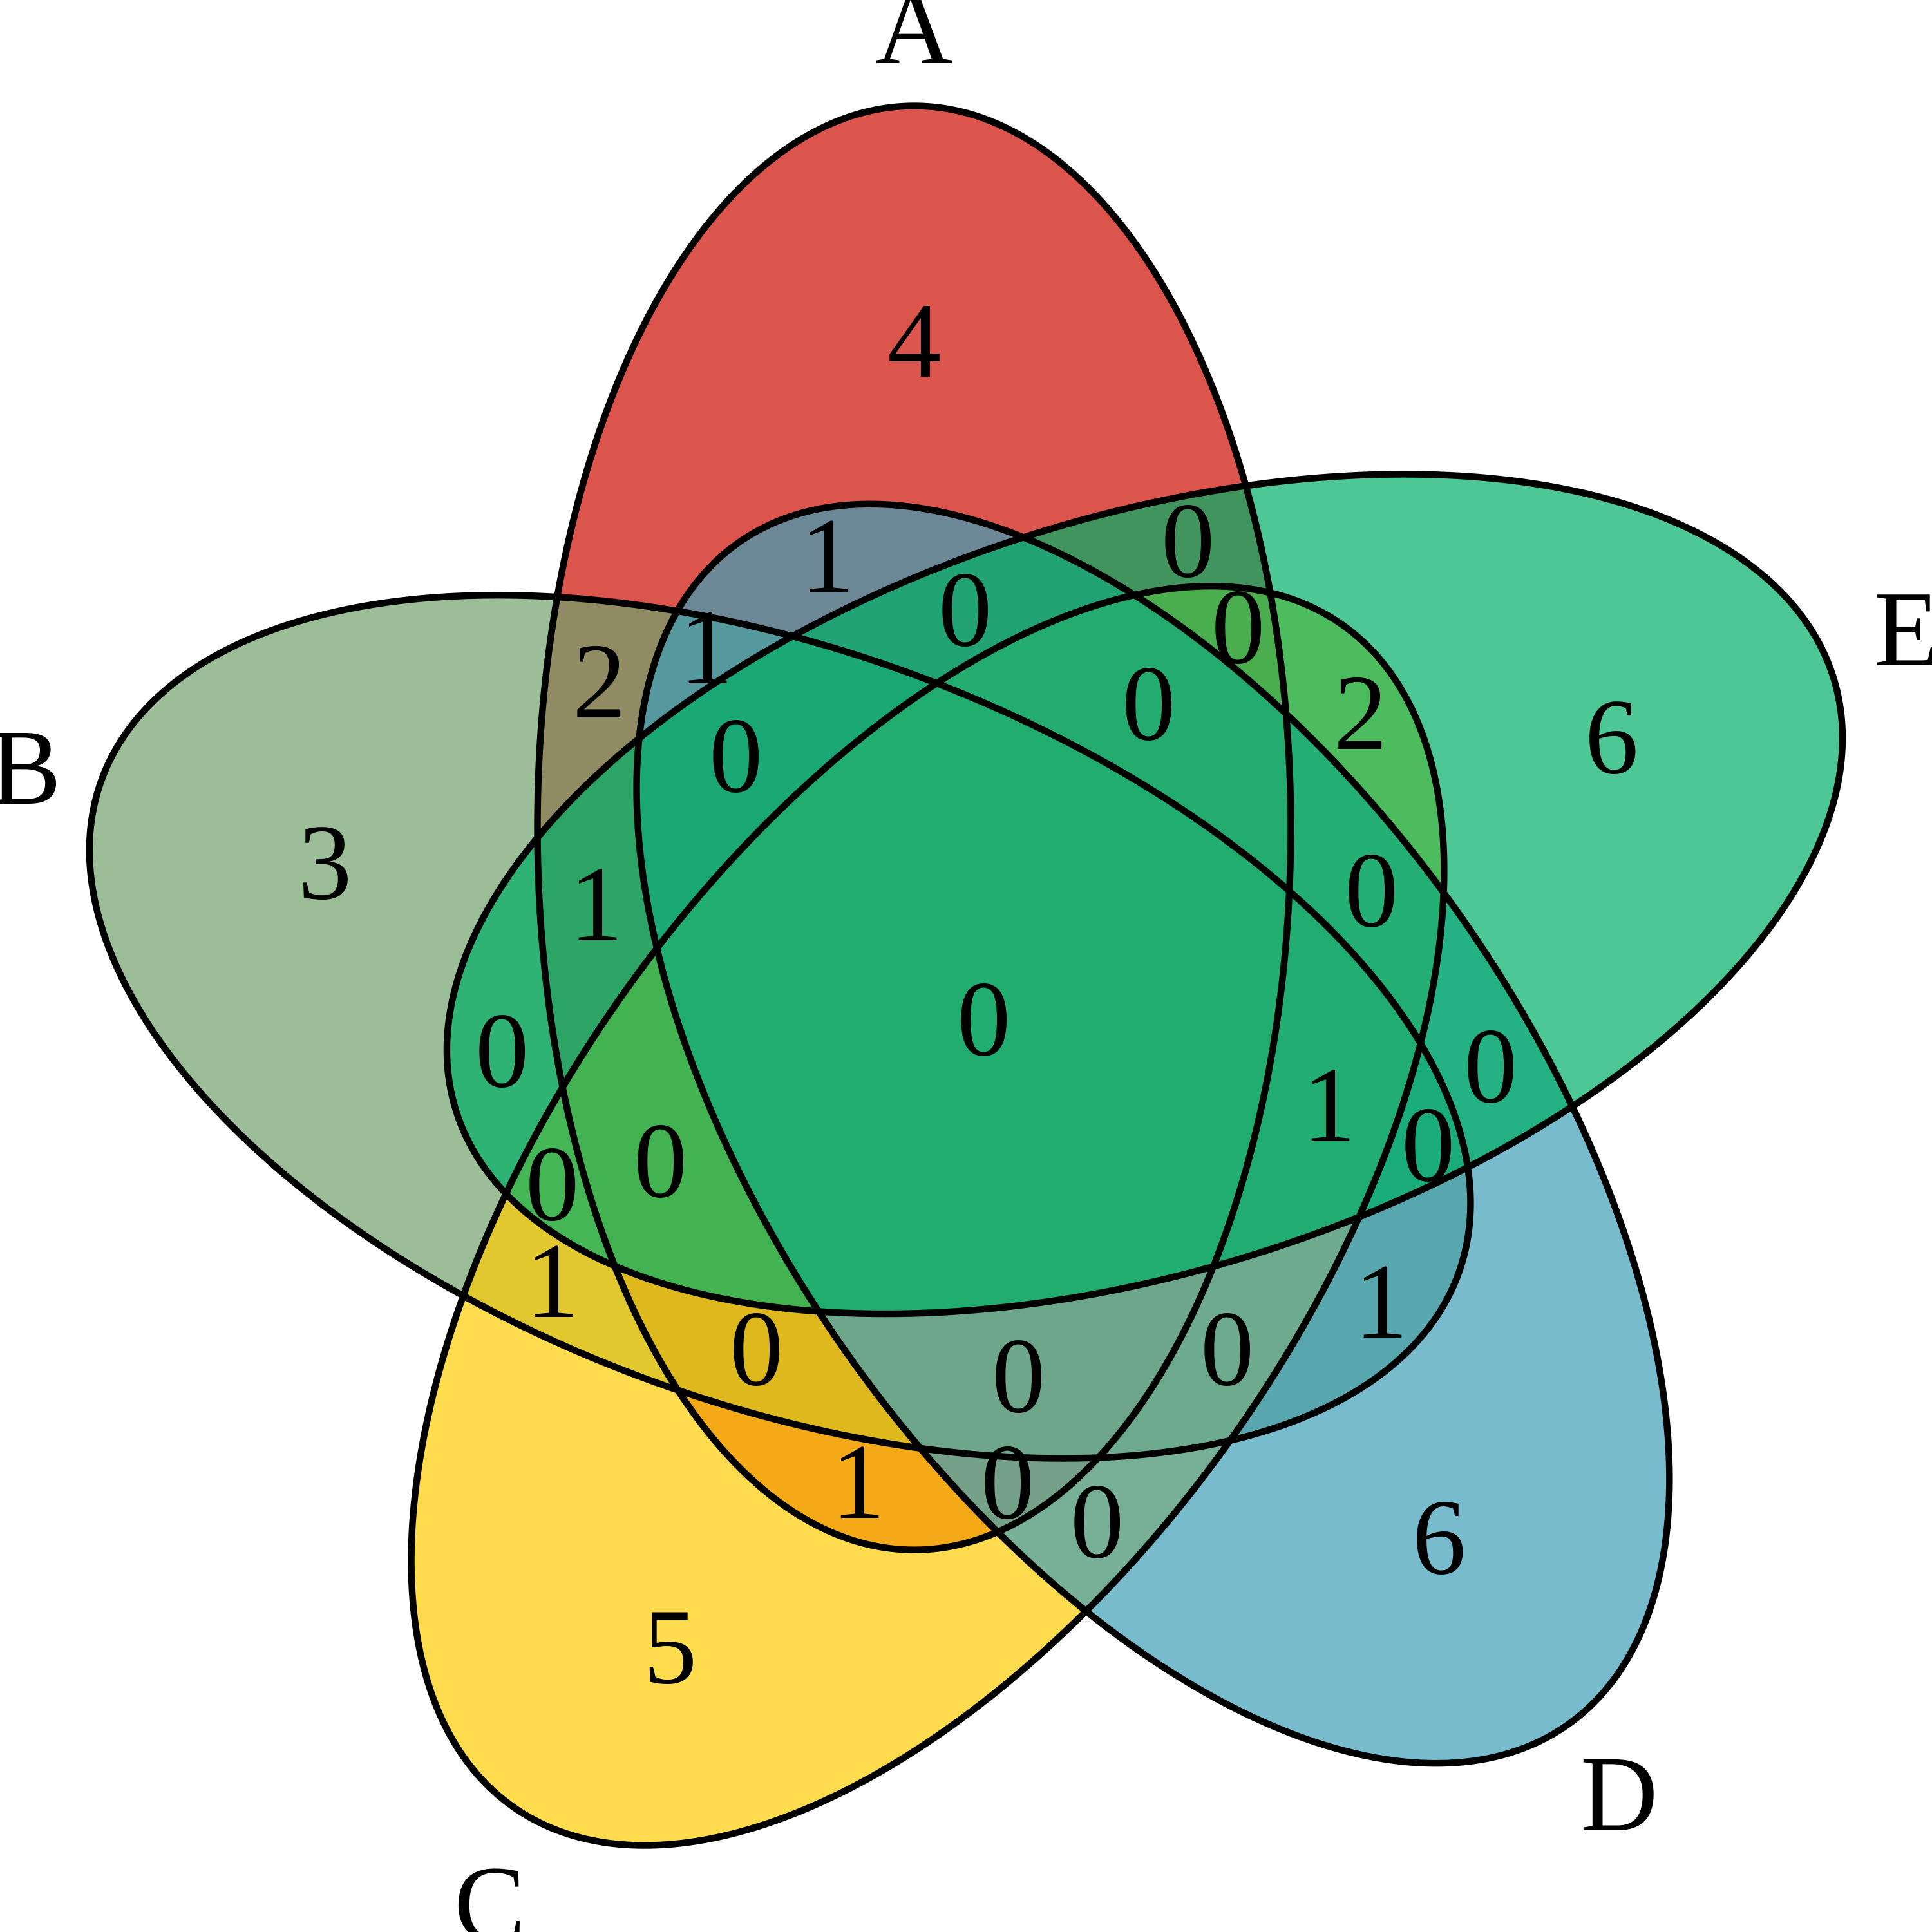
Venn
Draw a venn plot for the given dataset